Udeshani, Gayanthika. “Getting Useful XML out of Microsoft Excel.” Presented at Balisage: The Markup Conference 2022, Washington, DC, August 1 - 5, 2022. In Proceedings of Balisage: The Markup Conference 2022. Balisage Series on Markup Technologies, vol. 27 (2022). https://doi.org/10.4242/BalisageVol27.Udeshani01.
Balisage: The Markup Conference 2022 August 1 - 5, 2022
Balisage Paper: Getting Useful XML out of Microsoft Excel
Gayanthika is an Associate Architect at Typefi, where she leads the XSLT team and
provides support for other software solutions as well.
Gayanthika holds a Masters of Science (MSc) in Software Architecture from the University
of Moratuwa, Sri Lanka. She has over 11 years of experience as a developer and she
joined Typefi in 2018.
This paper presents a solution that transforms a Microsoft Excel Open XML Spreadsheet
(XLSX) file into a shallow-structured XML file used at Typefi, called Content XML
(CXML),
using XSLT and XProc.
This solution has three main research areas:
The XProc pipeline to read the Excel file content.
Transform Excel tables to a CALS table using XSLT functions.
Transform Excel charts and embedded images. Significant information is read from the
chart.xml and converted to a Scalable Vector Graphics (SVG) file, and then referenced
as an image in the output XML.
The XLSX file can contain various elements such as tables, charts, and graphics. This
solution does not yet use all the features available within the Excel XML but is a
work in
progress and future improvements will be guided by customer requests.
I would like to thank my colleague Max Zhaloba for his valuable comments and
clarifications related to XProc and XSLT, and also Damian Gibbs, Kate Prentice, and
Anupama
Wimalasooriya for helping me to review the content. Finally, I would like to thank
Typefi for
the motivation and support.
Introduction
This solution transforms a Microsoft Excel Open XML Spreadsheet (XLSX) file into a
shallow-structured XML file used at Typefi, called Content XML (CXML), using XSLT
and XProc an
XML- based programming language for processing documents in pipelines.
Previously in Typefi, the XLSX to CXML transformations were performed using Java packages,
usually the Apache POI package, which provides APIs for manipulating Office Open XML
documents. This approach required a significant amount of Java knowledge, and for
someone with
little Java experience, handling the available functionalities of the Apache POI was
not
convenient in comparison to the XSLT transformations. Many systems convert XLSX to
other XML
schema transformations using Java language, but identifying the internal structure
of an XLSX
file and processing them is the real challenge.
A solution could use several of these technologies, but the approach outlined in this
paper uses XSLT—mainly XSLT 3.0 features. While the amount of code needed to filter
out all
the Excel formatting information is significant, the goal is to make the code reusable.
This
goal is accomplished by providing reusable functions to access features within the
XLSX
elements easily. Moreover, the solution includes an 'xlsx-to-cals' mode that transforms
Excel table
information into a CALS table. The "CALS Table Model" is the most widely adopted industry
standard of SGML/XML representation for tables. Further, this research provides modules
that
transform charts (bar chart, pie chart and line chart) into SVG files. This general
approach helps to transform XLSX tables and charts into XML schemas other than CXML
because CALS tables and SVG files are well-known formats. The XSLT solution outlined
in this paper is executed from an XProc pipeline, with ANT scripts used to call the
pipeline and XML Calabash running the XProc pipeline..
In this solution, the final output is Content XML (CXML) which is a DocBook-like XML
scheme used internally in Typefi products. It is an intermediary format to facilitate
converting any input file format to another format, such as Adobe InDesign. CXML is
optimised for page layout (i.e. InDesign/PDF) or digital production (i.e. EPUB, HTML,
DAISY).
XLSX files can contain tables, charts and graphics, which all play a significant role.
Therefore, this paper focuses on processing these elements and transforming them into
the corresponding CXML elements according to the CXML schema 3.2.
This paper examines how the XProc pipeline reads the .xlsx file along with the information
from the various XML files and how the XSLT transforms the content using the elements
and attributes into a different XML schema—CXML.
Please note: This paper uses @ in front of names to denote attributes of an element.
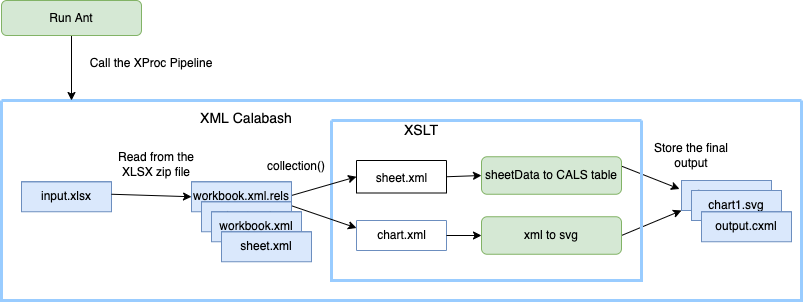
Figure 1 illustrates the high-level design of this system.
Figure 1: High-level project architecture
XLSX overview
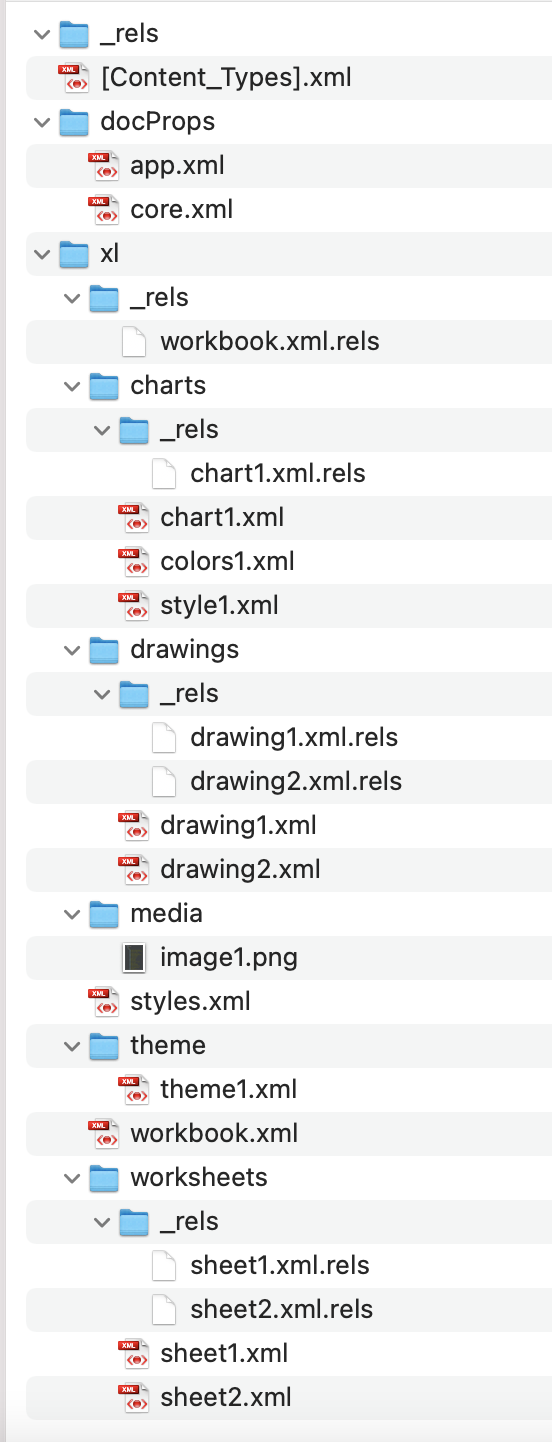
The XLSX file type was introduced in 2007 as the disk form of Excel spreadsheets when
Office 2007 was released. XLSX is a ZIP package that contains many XML files and is
organised according to the Open Packaging Conventions (OPC). The XLSX system follows
this
folder structure with several functions to read the corresponding files such as relationship
files, sheet.xml, and chart.xml.
Table I
The XLSX file structure
XLSX folder structure example
Folder/sub-folder titles
Information contained within these folders
_rels
Relationships to the primary XML documents and other key parts are included here.
[Content_Types].xml
All XML file references included in the package are referenced here.
Content types for parts within the package are also listed in this file.
docProps
Overall document properties are contained here.
app.xml: information about the file content.
core.xml: information about the author, created and modified dates etc.
xl
Details about the content of the file are listed here.
charts: Information relating to inserted charts.
drawings: graphics related information.
media: Image files.
theme: Theme-related details.
worksheets: worksheet-related information.
XProc pipeline
Calabash is used to implement an XProc pipeline that reads the files from the input
XLSX file and passes the information as a collection() to the XSLT. More information
about XProc is available in "XProc 3.0: An XML Pipeline Language" [23].
Using the ANT script we can extract the Excel file and pass the disk location to the
XSLT.
However, the advantage of Calabash is that everything flows through the pipeline and
does not
require to be saved to a disk unless we use p:store explicitly.
The first solution writes the unzipped file into the disk. Having
cx:decode="true" in the p:store is important, otherwise the XSLT
function collection() could not detect the extracted content as a valid XML
file, instead returnining an xs:base64Binary object, while the expected output was a
document-node().
The following code segment demontrates how to pass the Excel file as a collection
to the XSLT program. This idea is proposed by one of our team members, Max Zhaloba.
This is the recommended way, as it does not need to write the intermediate content
into the disk.
This XProc pipeline follows these steps:
Get the input parameters from the ANT script (input file path and the XSLT stylesheet).
Unzip the XLSX file
Iterate over the ZIP file and add the file path as an attribute. This will be used
from the XSLT side to read the file content.
Call the XSLT program and pass the unzip file information as a parameter.
The following code segment can be used to read the inner files of the unzipped file
from the XSLT side. All files will be accessed using the corresponding file name.
The transformation to CXML begins with an XLSX input file which is processed to access
the
inner files. As explain in the previous section, this program is initialised using
ANT
scripts; then an XProc pipeline is executed using XML Calabash.
Most transformations are triggered from the sheet.xml which resides in the xl/worksheets
folder. The sheetData element in the sheet.xml contains the information needed to
be converted to a tps:table element and the following sections will discuss this
in more detail.
The XLSX to CXML solution was developed out of two major research areas:
Map the XLSX table information to the CALS table elements and attributes.
Convert the chart.xml into an SVG and map it to tps:image elements and attributes.
The XLSX to CALS transformation happens as a pre-processing mode, then in the default
mode, it will be converted to CXML schema; SVG files are referred to as images in
this schema.
The solution provides a CXML file as the final output. The XLSX to CALS transformation
adds
flexibility to this allowing mapping to XML schemas other than CXML since it uses
CALS table
and SVG formats.
Solutions to the above scenarios are developed using XSLT 3.0.
Input XML
Workbook.xml contains information about the available worksheets. The attribute value
of the r:id maps to the related sheet.xml. This XSLT transformation starts to trigger the templates
from the sheet.xml.
The following is a sample sheets element in the workbook.xml
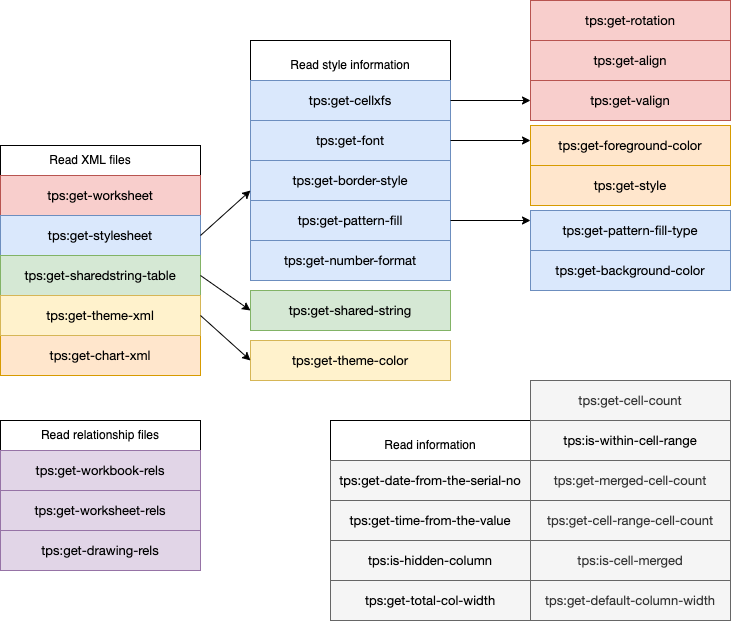
The following diagram shows the functions created to access the XLSX features. Other
than these functions, matching templates are triggered to convert the sheetData into a CALS table as well as for the chart conversion.
Figure 2: Overview of XSLT functions
Table 2 explains the available functions and the purpose of each.
Table II
Function definitions
Function
Description
tps:get-worksheet
Read the sheet.xml
tps:get-stylesheet
Read the styles.xml
tps:get-sharedstring-table
Read the shared string table from the sharedStrings.xml
tps:get-theme-xml
Read the theme.xml
tps:get-workbook-rels
Read the workbook.xml.rels
tps:get-worksheet-rels
Read the sheet#.xml.rels
tps:get-drawing-rels
Read the drawing#.xml.rels
tps:get-chart-xml
Read the chart.xml
tps:get-cellxfs
Get the /styleSheet/cellXfs/xf elements
tps:get-font
Get font elements from the style.xml
tps:get-border-style
Get the style of the bottom, top, left, right borders.
tps:get-pattern-fill
Get the /styleSheet/fills/fill/patternFill/@patternType from the styles.xml
tps:get-theme-colour
Get the /styleSheet/numFmts/numFmt[2]/@formatCode from the styles.xml
tps:get-align
Get the horizontal alignment of the cell
tps:get-valign
Get the vertical alignment of the cell
tps:get-rotation
Get the rotation information from the styles.xml
tps:get-foreground-colour
Get the font colour
tps:get-style
Get the style applied to text, bold, italic, underline, strikethrough, superscript
and subscript. This can be individual or a combination of them.
tps:get-background-colour
Get background colour of the cell
tps:get-total-col-width
This function is used to calculate the total column width
tps:get-time-from-the-value
Convert the decimal value to the correct time format
tps:get-date-from-the-serial-no
Convert the serial no to a date
tps:is-hidden-column
Check whether a column is hidden
XLSX tables
This section considers XLSX files with tables. The XSLT transformations to convert
XLSX into CALS table markup (with example XPath) is explained, and guidelines to apply
user-defined XSLT functions are provided.
Table 3 displays the corresponding CALS table element mapping for the Excel elements
of the sheet.xml.
Table III
XLSX elements map to the CALS table elements
XLSX element
CALS table element
sheetData
Header rows, footer rows are defined by the user through the application
interface, see Figure 11.
The <entry> element is used in this solution to create table cells and has several attributes,
so further discussion about cell-related information is important. Therefore, the
following section explains about XLSX cell elements and related features and attributes.
Cell range
In order to access the cell range, tps:get-worksheet() will return the selected worksheet as the $worksheet variable. This is either user-specified by using an input parameter, or it considers
the tabSelected value to read the specific sheet (i.e <sheetView tabSelected="1" workbookViewId="0"/> tabSelected="1" specifies that the corresponding sheet is currently selected).
The xlsx-to-cxml transformation should limit the processing of cells to the given
cell range. This is defined by the dimension element for a particular table.
This element represents a cell in the Excel worksheet, and the information about the
cell’s reference (@r) , formatting (@s), data type (@t), value (is- rich text inline, v - cell value) and the formula (f) are expressed. In this application, the formula-related transformation has been
ignored.
Cell reference (@r)
The solution identifies the location of a particular cell using cell reference information,
and analyses whether a cell is within the cell range or whether it is within a merged
cell range.
Possible data types
n - number (the default)
b - boolean
d - date
e - error
inlineStr - an inline string
s - a shared string
str - a formula string
The following section describes a shared string data type (s).
Shared String Table (sst)
The Shared String Table serves as a collection of individual String Items (<si>). It contains two attributes: @count - total number of text strings in the workbook, @uniqueCount - total number of unique text strings.
When the data type (@t) of the cell (c) indicates a 's' then the corresponding value should be read from
the sharedStrings.xml
         <c r="A7" s="14" t="s">
             <v>6</v>
         </c>
The above sample cell element value is 6, therefore, it maps to the 7th string item
of the shared string table (/sst/si[7]/t).
In CALS, @nameend and @namest attributes define the horizontally-merged cells. The @r value is used to identify the cell reference, then the system has defined several
functions to identify whether that particular cell is within a merged cell range.
This function tps:is-within-cell-range($cell, $ref) is used to check the whether a given cell reference is within a cell range, the same
function is used to process the merged cells and it needs the current cell and the
mergeCell/@ref value as parameters. The following code segment demonstrates how it processes the
@nameend attribute
The function tps:get-merged-cell-count(@r) gets the cell reference as a parameter, and if that cell is within a merge cell range,
then it will get the difference between the columns. For instance if the mergeCell/@ref is A7:C7 string-to-codepoints($last-col) - string-to-codepoints($first-col) will return 2. The @namest defines the cell position corresponding to a particular row. So if the @namest is 1, then the @nameend value will be 3.
The <xsl:template
match="excel:c[not(normalize-space())][tps:is-cell-merged(@r)]"
priority="10"/> template will remove the blank cells related to the merged
cell range.
The above mergeCells element <mergeCell ref="A4:A5"/> indicates vertically merged cells, and the solution defines them using @morerows in the CALS tables.
Style overrides
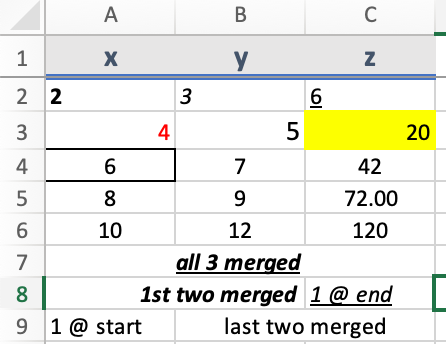
Figure 3 can be used to explain more about these cell formats, it has applied different
kinds of formatting. These can be considered in the following sections to discuss
how this solution considers such input and applies cell format attributes to the final
output.
A2 cell value is left aligned and it is styled as bold.
A3 cell value has applied red as the font colour.
A4 cell has borders in it.
C3 cell has a background colour.
the 7th row has some italic and underline text.
C5 cell value has a number format applied to it.
Figure 3: Sample Excel table
For instance, cell A3 can be considered and the following is how it is displayed in
the worksheet.xml.
         <c r="A3" s="9">
             <v>4</v>
         </c>
Note: All the style-related numbers are 0-based indexes (i.e., 0 maps to the 1st element
in the style.xml).
The @s maps to the /styleSheet/cellXfs/xf[10],
<xf numFmtId="0" fontId="2" fillId="0" borderId="0" xfId="0" applyFont="1"
                           applyAlignment="1">
, and Table 4 provides details about the available
style information in the styles.xml. The @applyFont and @applyAlignment attributes
store
boolean values indicating whether the corresponding formatting specified for this
xf
should be applied or not.
fontId maps to the corresponding font element,
vertAlign/@val can be either superscript or subscript, strike element
relates to the Strikethrough style.
The mapping between the XLSX cell-format attributes, number format and the style
attributes of the XLSX XML are listed in Table 4 with sample input elements and
XPaths. The CALS table format does not support styling attributes; therefore, the
information related to CXML style overrides (tps:c type="cell-format" and the
tps:style) are parsed from XLSX to CALS during the xlsx-to-cals processing
mode by using processing instructions. The information available with these processing
instructions is converted to CXML style overrides and the number format is done during
the stage where it processes the cell value-related information.
Here is an example of a table cell (<entry>) with the style and cell-format information which are represented using processing
instructions:
The @align and @valign attributes of the CALS table are filled from the above cellXfs/xf/alignment/@horizontal and cellXfs/xf/alignment/@vertical attributes and in the absence of these elements it considers left and bottom respectively as the default values.
The cell text rotation is defined using the @textRotation value of the above <alignment> element.
Font style
In the above xf element, fontId="2" maps to the following font element /styleSheet/fonts/font[3].
The font element can contain a collection of style information such as bold (b), italic
(i) and underline (u). Furthermore, it provides the foreground colour and other information
related to the font style. Superscript and subscript formatting details are defined
using the vertAlign/@val. If a text is styled with strikethrough, this element will contain an element called
strike.
Background colour
Background colour is defined by the fill element of the styles.xml, fillId="3" maps
to the following fill[4] element and
/styleSheet/fills[1]/fill[4]/patternFill[1]/fgColor[1]/@rgb gives the
background colour information.
Both of these fgColor and bgColor relate to the background colour of a cell. If a
pattern is applied to a cell then bgColor defines the background of the pattern and
fgColor defines the foreground of the pattern. For instance if the cell pattern contains
'dots', fgColor is the colour of those dots. However, if it is a solid pattern the
fgColor colour can be considered as the background colour and it does not have anything
to do with the bgColor as demonstrated in the above example.
Border style
Border style is defined by the border element of the styles.xml, borderId="0" maps
to the corresponding border element /styleSheet/borders/border[1]. Border pattern is defined by the /styleSheet/fills[1]/fill[4]/patternFill[1]/@patternType value.
In the example illustrated in Figure 3, the A4 cell has borders in it. The border
element defines the left, right, top, bottom and the diagonal border styles and the
colour of it.
Number format
In the xf element of the styles.xml it contains the numFmtId attribute which defines
the number format of a particular cell value. For instance, numFmtId="171" relates to the <numFmt numFmtId="171" formatCode="0.000%"/> element. The format-number XSLT function can be used with this formatCode to format
the cell-value (format-number($value, $format-code)).
Open xml documentation lists a set of format codes, the corresponding numFmt id is
not explicitly save in the file, so when the styles.xml defines, a numFmtId and when
the
corresponding numFmt element is not present it needs to access the predefined format
codes.
Column width
It is important to calculate the column width based on the cols element details in
the input XML; it specifies the column width as the colwidth attribute of the colspec element in the output CXML.
The XLSX col element is not a mandatory element in the input sheet.xml. The following
is an sample input of a table which has 11 columns, This means that from column number
3 to 6 the width is 10.8125 and when it does not mention the column width for 8 to
10 columns, the system considers the default column width which is 11.
The custom columns are defined as above, and all other columns use the default column
width which is defined by the @defaultColWidth or the @baseColWidth in the sheet.xml.
The calculation of the colwidth = (column width/ total width) *100 % (eg: first column
:- 28.6875/143.75 * 100% = 19.96). This calculation is done using an XSLT function
which
applies the xsl:iterate feature of the XSLT 3.0. The following function can be reused
to
calculate the total column width which needs to be considered in a particular table
dimension.
     <xsl:function name="tps:get-total-col-width" as="xs:decimal?">
         <xsl:param name="cols" as="element(excel:col)*"/>
         <xsl:param name="default-col-width" as="xs:decimal"/>

         <xsl:iterate select="$cols">
             <xsl:param name="total" as="xs:decimal" select="0"/>
             <xsl:param name="next-min" as="xs:decimal" select="0"/>

             <xsl:on-completion>
                 <xsl:sequence select="$total"/>
             </xsl:on-completion>

             <!--Calculate the total width for a particular col element-->
             <xsl:variable name="cur-width" select="xs:decimal(@width * (@max - @min + 1))" as="xs:decimal"/>

             <!--When the custom width is not available consider the default column width-->
             <xsl:variable name="default-col-width-total"
                              select="xs:decimal(if($next-min != @min and $next-min != 0)
                                                 then  $default-col-width * (@min - $next-min) else 0)" as="xs:decimal"/>
             <xsl:variable name="new-total" as="xs:decimal">
                 <xsl:sequence select="$total + $default-col-width-total + $cur-width"/>
             </xsl:variable>

             <xsl:next-iteration>
                 <xsl:with-param name="total" select="$new-total"/>
                 <xsl:with-param name="next-min" select="xs:decimal(@max + 1)"/>
             </xsl:next-iteration>
         </xsl:iterate>
     </xsl:function>
When some sheet.xml files do not contain cols elements, the total column width is
calculated as default column width * number of columns.
Custom number formats
The capability of adding custom number formats provides greater flexibility for an
Excel user. The following example can be considered to explain this further, ';' is
used to separate the format string into different sections.
The following can be considered as a sample customer number format string _("$"* #,##0.00_);_("$"* \(#,##0.00\);_("$"* "-"??_);_(@_)
This number format can include;
One section: this will be applicable for all the values.
Two sections: first section applies for positive numbers or zeros, and the second
section applies negative numbers.
Four sections: first section applies to positive numbers, the second section applies
to negative numbers, the third section applies to zeros, and the fourth section is
for text.
Therefore, the above example has four sections and according to the cell value it
considers the corresponding section. The following code segment demonstrates this
implementation using XSLT.
Excel provides support for basic colours in custom number format. The following eight
colours are specified using the name: [black][white][red][green][blue][yellow][magenta][cyan].
Other colours are considered as index numbers in a custom number format, but this
application does not consider those.
For instance in the "$"#,##0.00_);[Red]\("$"#,##0.00\), the second section specifies ‘[Red]\("$"#,##0.00\), this indicates if the cell contains a negative number it should be formatted as
($0.00) with a foreground-color=#FF0000 (the hex value corresponding to 'Red').
Date and time formatting
In the Excel input XML, the dates are indicated as a serial number, it considers
1899-12-31 as the base date and adds the specified serial number to get the date.
Further,
it uses decimal numbers to specify the time, for instance, 0.5 indicates 06:00. In
order
to process date and time information, this solution provides two functions as explained
in
Table 2.
Conditional formatting
This section explains how conditional formatting is applied using the XSLT transformation.
In the following example, it applies conditional formatting where it compares the
value of B22 according to the operator (greaterThan) with the formula value; this
formula can be a static value as well. If the value matches the given conditions it
will read the dxfs[0] according to the dxfId then apply the given foreground-color
and the background-color to the B22 cell.
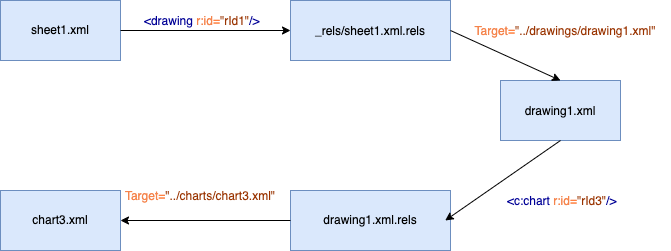
In order to process charts and graphs, the XLSX chart element is first converted into
an SVG file which is then inserted using the @ref in the tps:image element of the CXML.
Figure 4: A flowchart to map the chart.xml
Figure 4 illustrates how the solution navigates through the available files to identify
the corresponding chart.xml to be processed. When charts and graphs are inserted to
the sheet.xml, the 'drawing' element can be found within the elements. It directs
the _rels/sheet1.xml.rels to link with the corresponding drawing.xml. Drawing.xml
contains the graphic element with the relevant relationship ID to link to the chart.xml.
This solution provides separate functions to read each of these files when needed.
This research focuses on the chart.xml where it reads the available information to
understand which conversion needs to be actioned—pie chart to SVG, line chart to SVG,
or bar chart to SVG. Further, it is required to read the theme.xml to get the used
colour information.
Table 5 demonstrates the common elements in a XLSX which are related to charts.
The val="accent1" corresponds to the /a:accent1/a:srgbClr/@val in the
theme.xml. This system provides access to the theme.xml and to the specific color
details.
SVG (Scalable Vector Graphics)
Table 6 explains the elements that are available in an output .svg file.
Table VI
SVG element descriptions
Element
Description
<defs>
This is used to store the graphical element to be used in the following segments.
<path>
M x, y
M x, y
A
Elliptical arc: A rx ry rotate large_arc_flag sweep_flag x y
This command will draw an elliptical arc from the current point to x, y.
rx, ry - radius (major/minor axis)
rotate - in degrees clockwise
large_arg_flag and sweep_flag - control which section of the ellipse to use (1, 0)
L x, y
Line to x, y
<rotate>
Rotate (<a> [<x> <y>]) - rotation by <a> degrees about a given point. If [<x> <y>] are not supplied, the rotation is about the origin of the current user coordinate
system. y
<clipPath>
A clipping path specifies the region to which paint should be applied. Then the parts
of the drawing that lie outside of the region bounded by the clipping path are not
drawn.
<circle cx="50" cy="50" r="50"/>
This command will draw circles based on a centre point and a radius.
<use>
This element takes nodes within the SVG document and duplicates them somewhere else.
<rect>
This draws rectangles, defined by their position, width, and height.
<text>
This element helps to draw graphics elements consisting of text
<line>
This creates a line connecting two points
To investigate the possibility of supporting XLSX graphs and charts using XSLT, the
solution has considered an input file with a simple pie chart, a line chart, and a
bar chart.
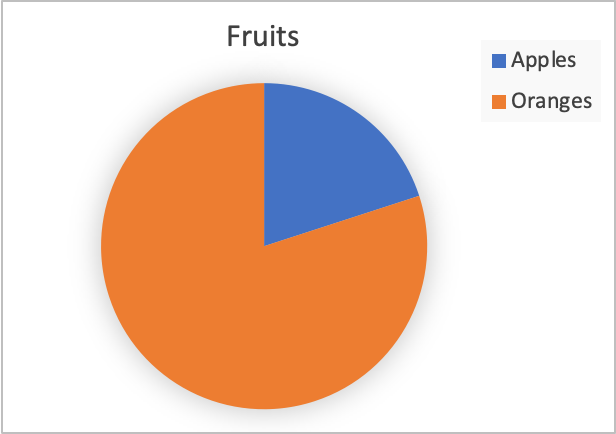
XLSX with a pie chart
The XSLT transformation that creates the pie chart uses elliptical arcs and fills
them
with specific colours. The feature available with clipPath in the SVG is used here
so only
the information within the specified region is visualised to the user. The following
demonstrates the sample input (Figure 5) chart used to implement the pie chart functionality
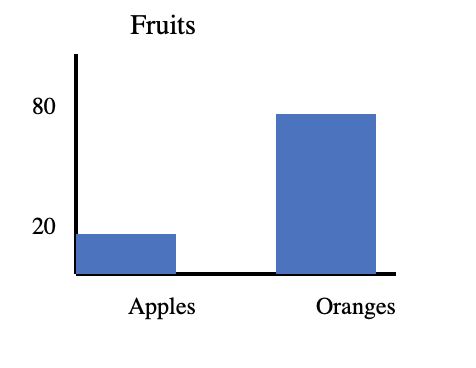
and the output (Figure 6 - .svg file) it provides from the proposed XSLT transformation.
Figure 5: Input XLSX pie chart
Figure 6: Sample Output SVG of a pie chart
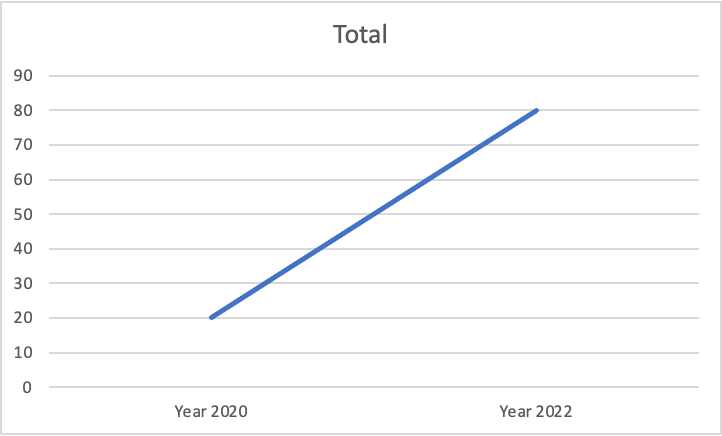
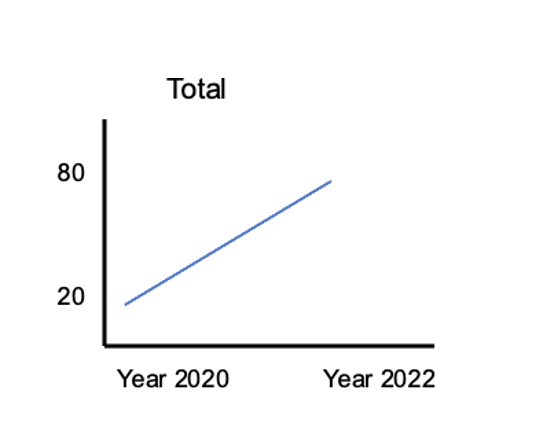
XLSX with a line chart
The information available in Table 5 can be used to map the input chart.xml (Figure
7) into the output SVG (Figure 8) which represents a line chart.
Figure 7: Sample XLSX line chart
Figure 8: Sample output SVG of a line chart
XLSX with a bar chart
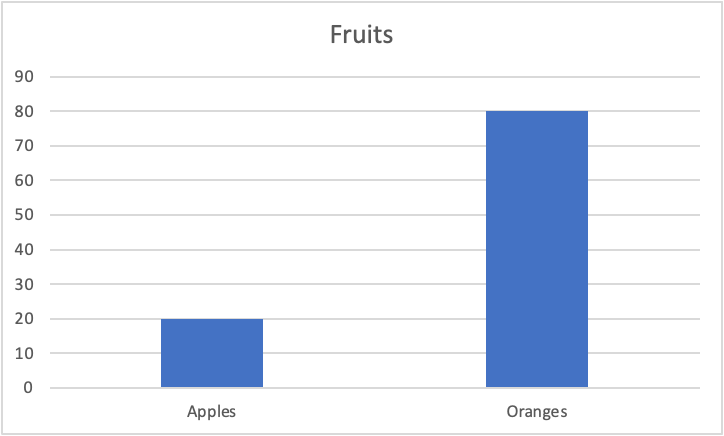
Figure 9: Input XLSX bar chart
Figure 10: Sample output SVG of a bar chart
The following source code shows that the conversion of the bar chart and the line
chart are similar, except in the line chart it uses a path and in the bar chart it
uses a rect.
The use case for Typefi is embedded Excel files within Word documents, but can also
be used for standalone Excel documents.
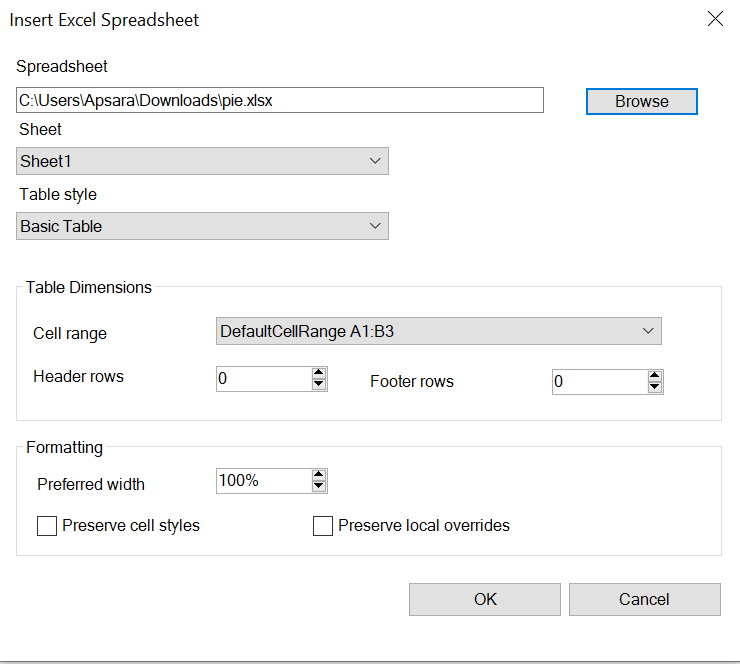
This application considers some input parameters (Table 7.), and the following user
interface prompts the user to fill them.
Figure 11: Dialog box of Typefi Writer to get input parameters
The following element will be added into the docx file with the user-provided information.
<w:instrText>Sheet="Historical Performance" CellRange="C6:J22" FooterRows="0" HeaderRows="2"
                     PreferredWidth="100" PreserveCellStyles="False" PreserveLocalOverrides="False"</w:instrText>
Table VII
Parameter descriptions
Category
Sample data
Description
Sheet
Historical Performance
Sheet name
CellRange
C6:J22
Docx file contains the cell range of the table, which cells were included in the docx
file as a table.
FooterRows
0
Number of footer rows
HeaderRows
2
Number of header rows
PreferredWidth
100
This relates to the amount that the table can take up when it is positioned in InDesign.
PreserveCellStyles
False
Using the Excel cell styles, this maps to the @type attribute on the <entry> in CXML which in turn maps to Cell styles in InDesign.
PreserveLocalOverrides
False
Add cell-format values to the entry/@style attribute.
The sheet name, cell range, footer/header rows and the referred width values are passed
to
the XSLT as parameters and will be used during the transformation.
The proposed solution will convert the table information to a tps:table element, and charts and image references to tps:image elements in the CXML. Images and charts are transformed into separate image files
and the tps:image element will reference the image file.
Discussion
The previous approach, with the Apache POI, read the XLSX file using the streaming,
as it was memory intensive when handling large or memory-intensive files. Ultimately,
limitations with this approach prevented us from implementing specific features and
maintaining the code with bug fixes. The existing application supports Word documents
that are processed using XSLT features. Therefore, our goal is to use a similar approach
in the Excel converters.
Meanwhile, the XSLT approach provides the flexibility to read the required cell range
of a particular sheet.xml without considering the entire XLSX file. In other words,
this custom XSLT implementation will read the XLSX files at the lowest level possible,
giving the maximum control and flexibility possible to help bypass the restrictions
of the Apache POI API.
Compared to the Java solution, an XSLT developer would find it easier to use XSLT
to do these transformations, adding more flexibility by mapping the information into
the output XML schema. Finally, XSLT is the globally accepted methodology for XML
transformations. Therefore Java code is less suitable than XSLT for document format
transforms and conversion to XML.
The XProc pipeline was a new research area that delivered a unique solution to read
an
Excel file and pass it as a collection to the XSLT without writing into the disk.
An
inexperienced user of XML Calabash has to spend a considerable amount of time grasping
the
concepts of XProc language with the available online resources. Even though there
are several
other alternatives to achieve the same objective, we believe this was an ideal problem
to
demonstrate the application of XProc in such a domain. The listed resources related
to XProc
provide guidelines to troubleshoot various errors which occurred in several instances
during
the development of the final XProc pipeline. Several processors implement XProc 3.0
features,
but XML Calabash was compatible with the ANT script so this solution runs the pipeline
using
it.
This application provides a general approach by delivering the flexibility of converting
the XLSX tables into any other XML schema since this research provides a solution
around CALS tables. Moreover, the XLSX chart to SVG conversion stores the output chart.svg
files in a separate chart folder so it can be easily reused with any other transformation
or as a standalone application. Currently, the proposed solution converts the pie
chart, line chart and bar chart to an SVG output. It can be improved to support any
other chart formats and with complex data; however, as a proof of concept, this solution
considers only these types.
Further, the solution provides a separate set of functions to read each file, such
as the styles.xml, theme.xml, sharedStrings.xml, and relationship files. For instance,
tps:get-total-col-width function is implemented to calculate the total column width in order to calculate
the width proportion. In this case, it has used the XSLT 3.0 xsl:iterate feature, and it showcases a great application of that.
This paper presents the possibility of transforming an XLSX file into a different
XML
schema; however, this paper also identifies several limitations and future improvements.
For example, the current
solution does not consider shrinkToFit kind of alignment feature and
formulas, but this will be implemented as a future improvement. Also, the current
implementation considers the common input XLSX file structure to read the files in
corresponding order, but an arbitrary file structure (considering relationship files)
will be
considered in future versions.
Conclusion
This research covers three research areas— XProc pipeline, XLSX table to CALS table
transformation, and XLSX chart to SVG conversion. The solution uses XProc, XSLT, XPath
and ANT
scripts and provides a CXML file as the final output. This paper explains the input
file
element information and the required information to be fetched to fill the required
XML
output. CALS tables are derived from the information available in the sheet.xml and
other
related files. It further demonstrates how the solution converts the chart.xml into
an SVG
file by explaining the available features of the SVG schema.
The Excel file structure becomes too complex to be processed—with the size and available
information of the input file. However, based on the customer files, we decided which
features were required to be implemented. Ultimately, the solution will increase the
scope in the future.