Cayless, Hugh A. “Linking Page Images to Transcriptions with SVG.” Presented at Balisage: The Markup Conference 2008, Montréal, Canada, August 12 - 15, 2008. In Proceedings of Balisage: The Markup Conference 2008. Balisage Series on Markup Technologies, vol. 1 (2008). https://doi.org/10.4242/BalisageVol1.Cayless01.
Balisage: The Markup Conference 2008 August 12 - 15, 2008
Balisage Paper: Linking Page Images to Transcriptions with SVG
Hugh is head of the Research & Development group at the Carolina Digital
Library and Archives, UNC Chapel Hill. He holds a Ph.D. in Classics and an M.S. in
Information Science from UNC. His research interests include the application of
computational techniques to problems in Classics (and the Humanities in general),
and
Digital Curation.
This paper will present the results of ongoing experimentation with the linking of
manuscript images to TEI transcriptions. The method being tested involves the automated
conversion of images containing text to SVG, using Open Source tools. Once the text
has been
converted to SVG paths, these can be grouped in the document to mark the words therein
and
these groups can then be linked using standard methods to tokenized versions of the
transcriptions. The goal of these experiments is to achieve a much more fine-grained
linking
and annotation mechanism than is so far possible with available tools, e.g. the Image
Markup
Tool and TEI P5 facsimile markup, both of which annotate only rectangular sections
of an
image. The method envisioned here would produce a legible tracing of the word, expressed
in
XML, to which transcripts and annotations might be attached and which can be superimposed
upon the original image.
Mass digitization has become a fact of life at most major University Libraries in
recent
years. In the case of printed books, initiatives like Google’s and the the Internet
Archive’s
produce page images with attached metadata. These are OCR’ed and processed to make
them
searchable and readable via a web browser and (in the case of the IA) in a variety
of other
formats, such as PDF. These processes do not accommodate documents for which OCR is
currently
impossible however. Handwritten documents can, and are, regularly digitized, but human
beings
must produce transcriptions for them (if this is done at all) and the transcriptions
are
typically linked to the images only on the level of the page.
This project began as an attempt to see what could be done in an automated or
semi-automated way to allow linkage between transcription and image at a deeper level
and also
annotation of the image at the level of the text on the page. Transcription of the
text in a
page image can be considered a special case of annotation.
UNC Chapel Hill is contemplating a very large scale manuscript digitization project,
potentially covering the entire Southern Historical Collection. The Carolina Digital
Library
and Archives (CDLA) also has an ongoing, smaller, manuscript digitization project
funded by
the Watson-Brown foundation and several completed projects published under its Documenting
the
American South program which deal with manuscript images and transcriptions in TEI.
There are a number of existing tools that provide for user-controlled image annotation.
This is typically accomplished by providing the user with drawing tools with which
they may
draw shape overlays on the image. These overlays can in turn be linked to text annotations
entered by the user. This is the way image annotation works on Flickr, for example,
and also
the IMT. The TEI P5 facsimile markup conceives of text-image linking in this fashion
also.
Drawing rectangular overlays on top of an image is a good compromise between ease-of-use
and utility, and rectangles fit well with most types of written text. It does prompt
the
questions of whether it is possible to go deeper, however, and what to do with lines
of text
that aren’t able to be captured by rectangles. I noted with interest the proof-of-concept
work
my colleagues Sean Gillies and Tom Elliott did earlier this year using the OpenLayers
Javascript library as a means of tracing text on a sample inscription[1]. The vector drawings overlaid on the image are serialized as SVG which can then be
saved and used as a linking mechanism. Inscriptol was the inspiration for the work
presented
in this paper. Some further discussion about tools for text and image linking took
place on
the Stoa site at the same time.[2] The starting point for the experiments described here is a tool for tracing raster
images and converting them to vector graphics named potrace[3]. Potrace will convert a bitmap to SVG, among other formats. It is licensed under
the GPL. Tests with the tool on manuscript pages were promising, so I decided to see
whether a
toolchain could be constructed, using only Free, Open Source software, that would
start with a
manuscript image in a standard format such as JPEG and take it into an environment
where the
image could be linked to a transcription.
The Toolchain
The goal of this experiment is to see whether it is possible to go from a page image
and a
TEI-based transcription to a linked presentation of the two, using only Free, Open
Source
tools. In addition the experiment is intended to evaluate the extent to which this
process
might be automated and, conversely, where and how much human intervention will be
required in
the process.
Image preparation
The process of tracing a raster image to produce a vector analog requires a bitmap
format as input. The source images in DocSouth are most likely to be either TIFF or
JPEG, so
they must be converted to a source usable by potrace. The convert utility that comes
with
the open source image processing library ImageMagick[4] performs this function with ease using a command such as:
convert mss01-01-p01.jpg mss01-01-p01.pnm
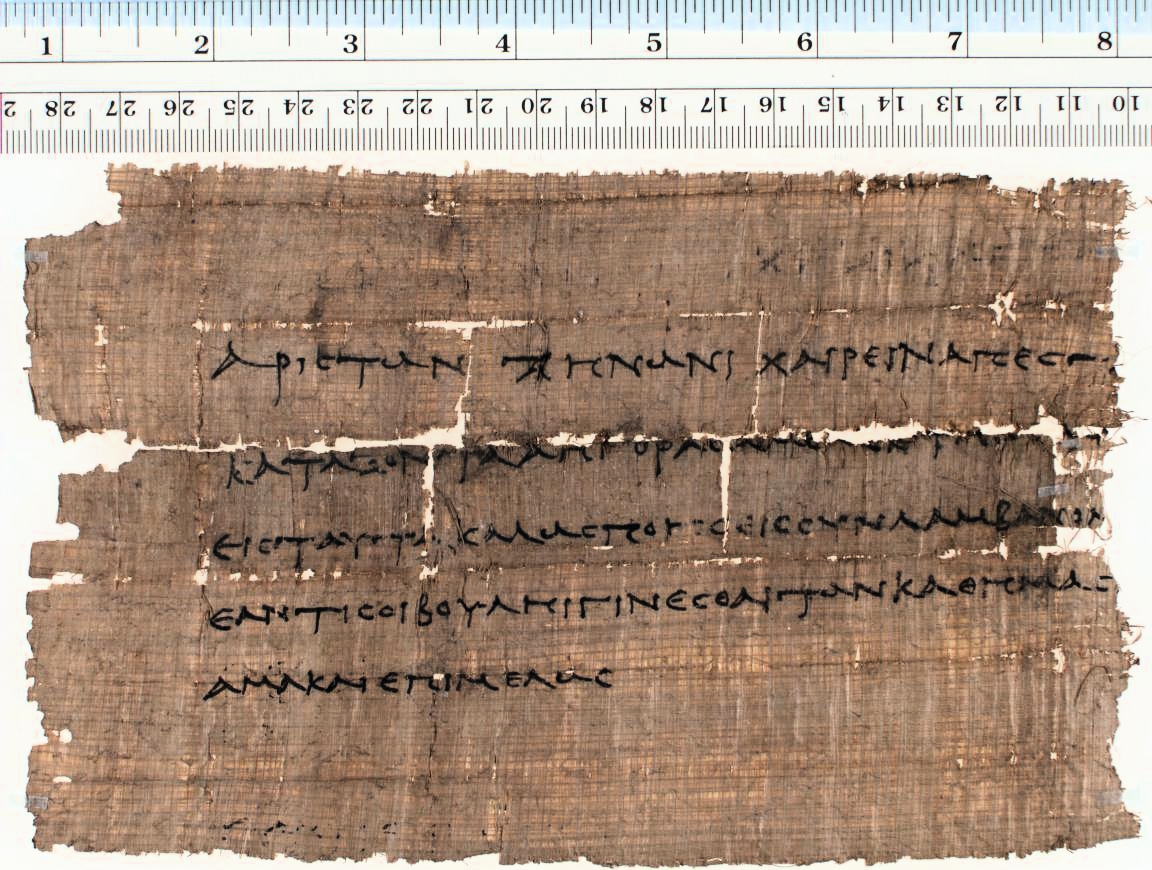
Figure 1
Papyrus (P. Mich. 1.78)
ImageMagick also supports a wide variety of additional image manipulations, and is
likely to prove useful in other kinds of image preprocessing. As we work on refining
the
techniques outlined here, it is likely that operations such as image sharpening and
increasing the contrast will be added to the preprocessing pipeline in order to produce
sources that potrace can do a better job of converting.
Conversion to SVG
Potrace handles the conversion from bitmap to SVG, as part of the process, it collapses
the image’s color space to 1 bit (black/white) and then creates vector paths tracing
the
black shapes in the image. Setting the cutoff at which it determines whether a pixel
becomes
black or white is one of the main steps at which human intervention is presently required.
In experimenting on a number of images, I was able to obtain good results after a
period of
trial and error.
The image in figure 1 was converted to the image in figure 2 using the following
command:
The black/white cutoff, represented by the -k parameter on the command, is
considerably different for a papyrus image like the one above than for paper.
Potrace produces an SVG document with paths that look like
They
use SVG’s moveto (m), cubic bézier curveto (c) and lineto (l) commands in relative
mode,
that is the first moveto command determines the start point of the path, and then
subsequent
coordinates are relative to that point. This mode is obviously a convenient notation
for a
program creating the paths, but it is less convenient for working with the paths,
so a
conversion to the absolute notation is necessary. In addition, the SVG output by potrace
is
marked as version 1.0 (although it is compatible with the current standard, 1.1) and
the
paths need to have ids assigned to them so that they will be able to be referred to
later.
SVG Cleanup
The SVG editor Inkscape (which in fact uses potrace internally to trace images) may
be
used from the command line to output a version of the SVG with the relative path notation
converted to absolute. If invoked with the -l parameter, Inkscape will output a ‘plain’
SVG
file without the additional namespaces the program typically adds. For example:
XSLT was used to insert id numbers and do additional small pieces of cleanup, including
the
removal of a duplicate SVG namespace and setting the version number to 1.1. After
processing, an example a path looks like
<path d="M 88.96875,276.20312 C 88.96875,276.89375 86.36875,280.42813 85.271875,281.2
C 84.825,281.48438 84.5,281.93125 84.5,282.175 C 84.5,282.37813 84.0125,282.94687
83.44375,283.39375 C 82.753125,283.9625 82.55,284.36875 82.834375,284.65312
C 83.321875,285.14062 86.978125,283.51562 90.065625,281.40312 L 92.178125,279.98125
L 93.4375,280.875 C 95.021875,282.0125 97.90625,282.45938 97.90625,281.60625
C 97.90625,281.28125 97.25625,280.79375 96.403125,280.55 C 95.55,280.30625
94.371875,279.65625 93.7625,279.16875 C 89.171875,275.30937 88.96875,275.1875
88.96875,276.20312 z M 90.390625,279.33125 C 90.146875,279.98125 87.34375,281.6875
86.571875,281.6875 C 86.2875,281.6875 86.9375,280.875 88.034375,279.85938
C 89.821875,278.15312 90.91875,277.90938 90.390625,279.33125 z" id="path13332"/>
SVG Analysis
At this point, we have an SVG document that is ready for analysis. The initial
experiment uses a Python script that simply attempts to detect lines in the image
and to
organize the paths within those lines into groups within the document. The paths are
sorted
left to right and top to bottom and then merged using a simple algorithm. The process
starts
with the bounding rectangle of the leftmost, topmost path and looks at the next path’s
bounding rectangle. If they overlap top to bottom more than 45%, then the two are
merged
into a group. This continues until no more overlapping rectangles can be found, and
the
remaining paths that have not been assigned to a group are passed to the function
again. The
process repeats until all paths have been assigned to a group. When analysis is complete,
the Python script writes the results out to disk in two formats. Initially, the script
produced an SVG file with grouped paths and with bounding rectangles inserted to make
the
boundaries of the line groups visible.
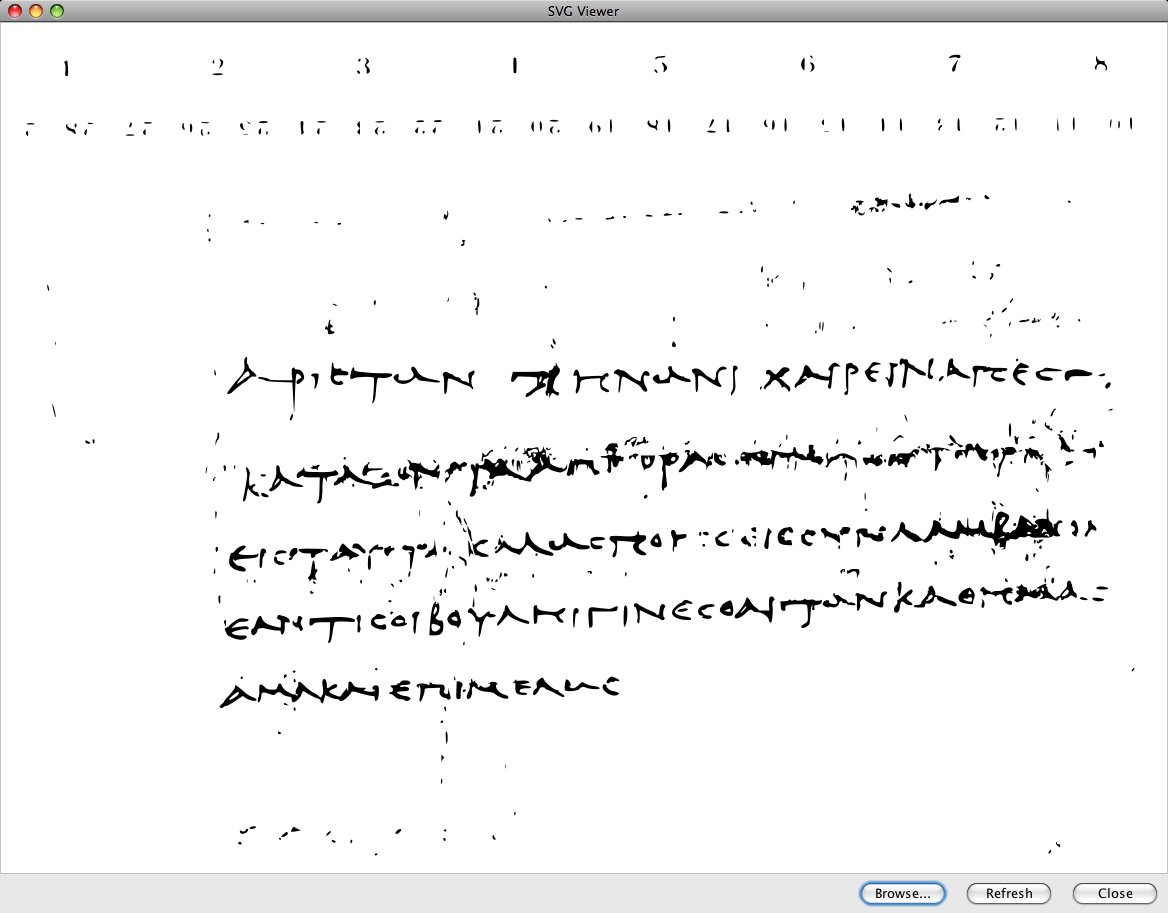
Figure 3
SVG with the original image embedded, after line detection.
Subsequently a Javascript serialization was added to support the browser-based
display described below.
Display
I noted above that the proof-of-concept work on tracing inscriptions by Elliott and
Gillies used an Open Source map display library called OpenLayers as the basis for
its
display and annotation capabilities. OpenLayers allows the insertion of a single image
as a
base layer (though it supports tiled images as well), so it is quite simple to insert
a page
image into it.
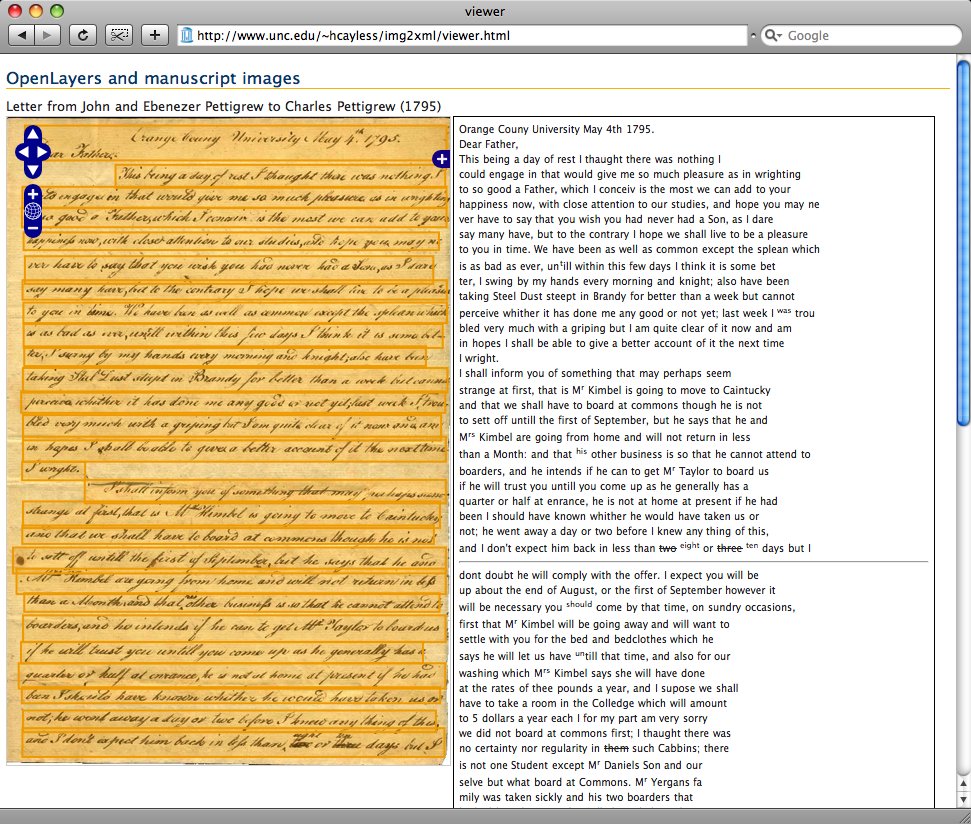
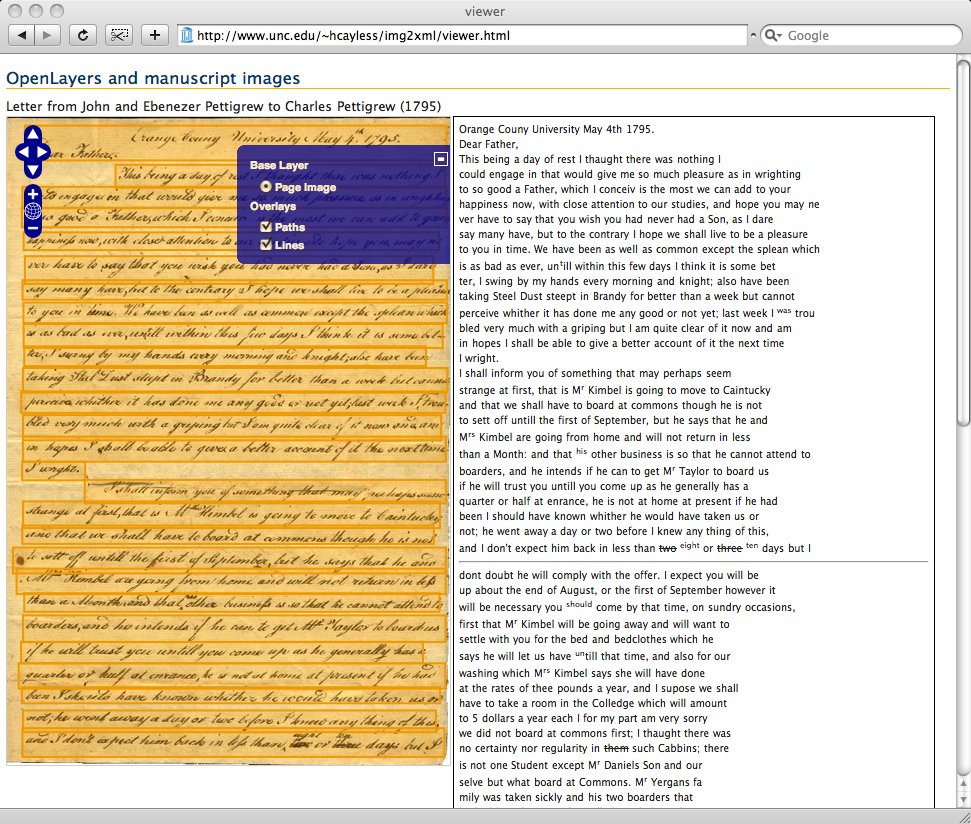
Figure 4
OpenLayers with embedded image and transcription
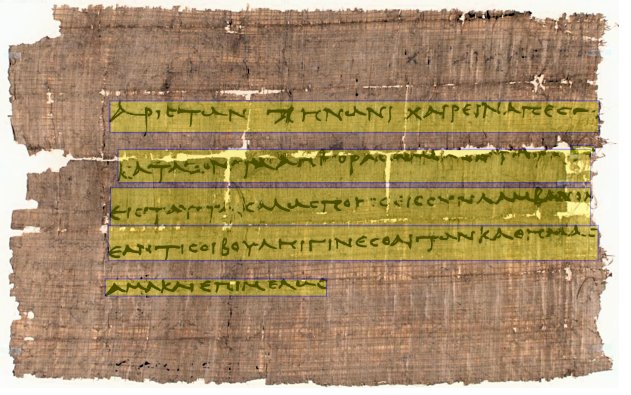
OpenLayers also supports simple vector structures, such as points, lines,
polylines, and polygons. It is therefore possible to represent the line-containing
rectangles generated by the Python script as a vector layer on top of a JPEG version
of the
page image.
Figure 5
The layers in the image viewer.
In order to display the paths traced over the writing itself, however, some
additional work had to be done.
The experimental system discussed here adds several functions to the OpenLayers library
in order to support paths and groups of paths. OpenLayers represents vectors in the
browser
using either SVG or VML, depending on the browser’s capabilities. This test only attempted
to display the traced text in Firefox and Safari, both of which have SVG support,
so only
the SVG serialization code was modified. In theory, the VML generation code should
support
similar functionality, but this has not been attempted. OpenLayers provides a very
useful
platform for display because it has built in functionality like zoom and pan, as well
as the
ability to turn layers on and off and to add event handlers for structures it draws.
This
enables, for example, highlighting to be activated when the mouse hovers over a line.
After the functions to store path data and serialize it as SVG were added to OpenLayers,
the Python script was modified to output instructions to OpenLayers in Javascript
that draw
the paths and bounding rectangles as separate layers on top of the image. OpenLayers
can, as
described above, enable the addition of even handlers to polygon features, so in order
to
demonstrate the ability to link the grouped vectors to lines in a transcription, I
matched
path group ids to their corresponding line number using a pair of JSON objects (e.g.
fig. #)
The event handler for a mouseover on one of the rectangles bounding a line of text
calls
a function that changes the color of the paths within the line and the stroke of the
bounding rectangle itself.
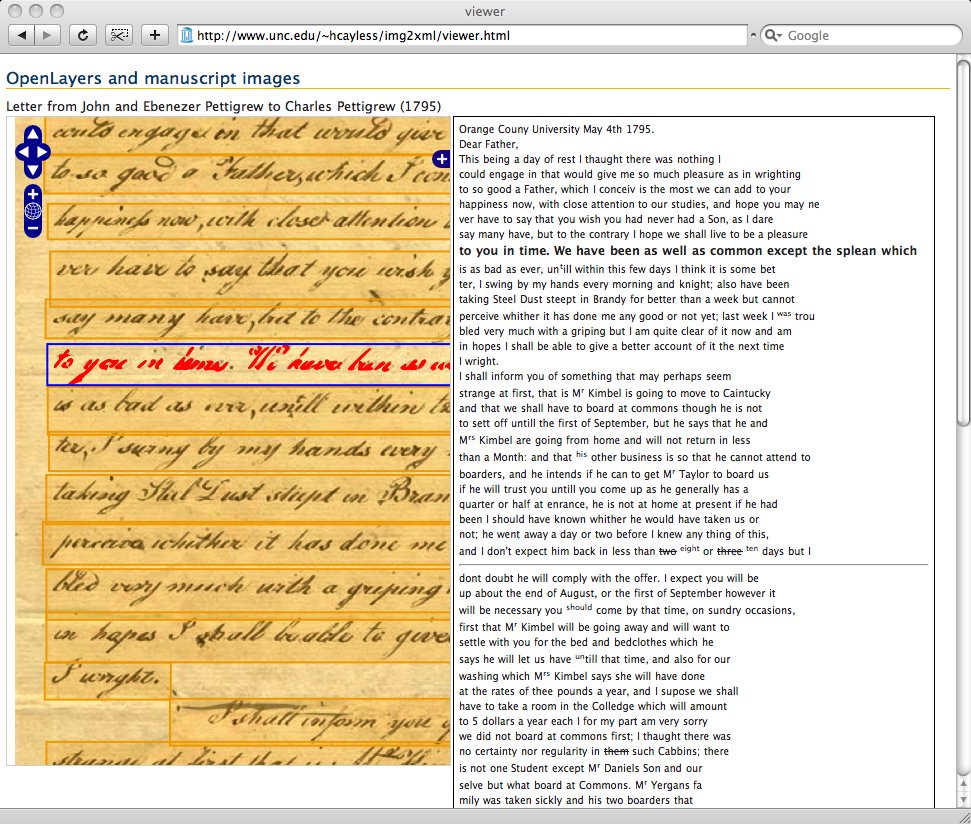
Figure 6
Hovering over a line in the image.
It also changes the font-weight of the corresponding line of text to bold. An
inverted data structure points from lines of text to paths and when a mouseover event
is
bound to the line, enables the highlighting of the path when a user hovers over a
line of
text.
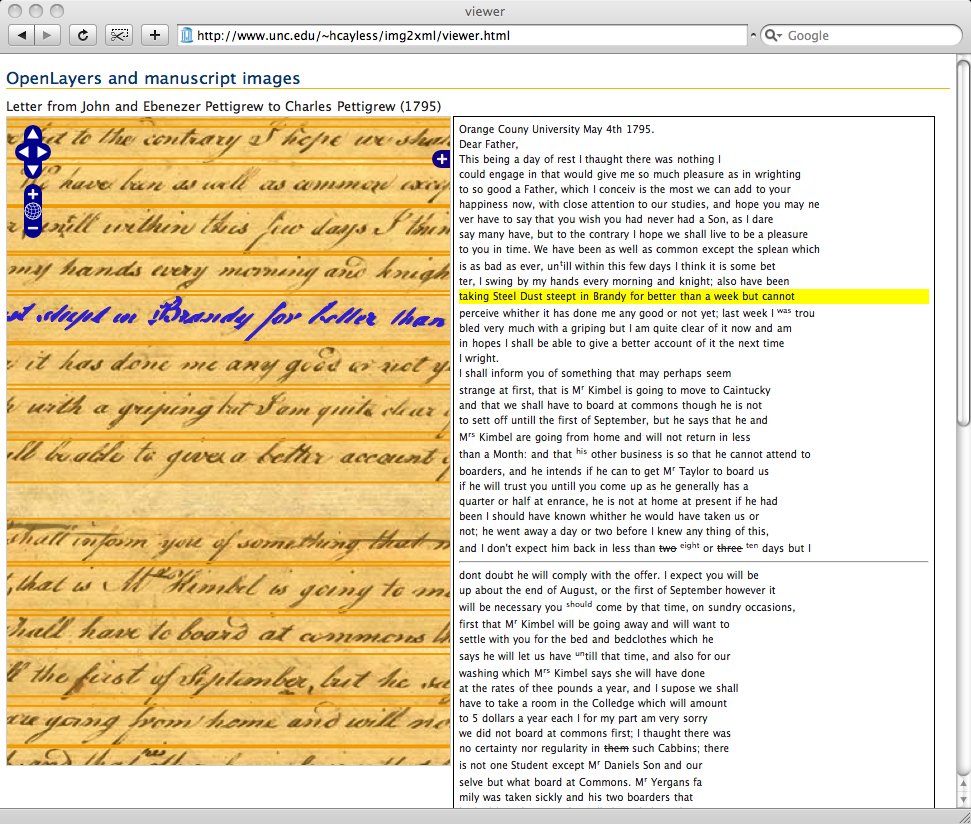
Figure 7
Hovering over a line of text.
Conclusions
The experiments outlined above prove that it is feasible to go from a page image with
a
TEI-based transcription to an online display in which the image can be panned and
zoomed,
and the text on the page can be linked to the transcription (and vice-versa). The
steps in
the process that have not yet been fully automated are the selection of a black/white
cutoff
for the page image, the decision of what percentage of vertical overlap to use in
recognizing that two paths are members of the same line, and the need for line beginning
(<lb/>) tags to be inserted into the TEI transcription (if it does not already
contain them). The tools employed to produce the SVG tracing and the interactive display
are
all stable and well-supported (although the path support added to OpenLayers needs
additional work). It seems clear that additional testing and the attempt to produce
a
working implementation will be well worth the effort.
Where to go from here
One question posed by the apparent success of the method is what should link to what.
What
structures in the vector graphics document can be detected (beyond lines) and how
should they
be linked to the transcriptions? There are some very thorny concurrency issues here,
since ink
from one letter may touch another, and thus form a single path consisting of multiple
letters,
making it impossible to isolate letters, or even words if the letters belong to different
words. A descender on the letter ‘f’ might touch a letter in the line below, making
it
impossible to easily identify the two lines as separate. These difficulties mean that
linking
word for word or letter for letter between documents is not necessarily possible.
The streams
are not parallel. Of course, vector paths can be sliced, and the image and text streams
therefore could be made parallel, but this kind of operation will almost certainly
require a
human being with an SVG editor such as Inkscape. A second, related issue is that text
transcriptions in XML may well define document structure in a semantic, rather than
a physical
way. Line, word, and letter segments can be marked in TEI, but they frequently are
not. The
DocSouth example used as a test case here does not have line breaks marked, for example.
The mechanism used for linking bears further thought and study. The current implementation
hand waves over the problem, simply mapping an id in one document to one or more ids
in the
other and vice versa using JSON. It would be much better to develop a standard for
this kind
of linking, since there is no guarantee that the id from one document would easily
be
available to the other. TEI P5 envisions the alignment of different document streams
of this
type using a link group [5]. Using TEI for this is a possible solution, but it does involve changing the TEI
document, which may not be desirable. As the P5 standard remarks: “If it is not feasible
to
add more markup to the original text, some form of stand-off markup will be needed.”
Stand-off
markup seems a better solution in the abstract, but it isn’t immediately clear what
is the
best way to implement this solution.
The proof-of-concept system illustrated above attempts to detect lines only, and that
in a
very simple way, by looking along the x-axis for overlapping structures. Probabilistic
methods
may well prove the best way to determine whether any given path belongs to the same
group as
another path, or whether a previously constructed group really holds together. The
algorithms
for structure detection therefore need a great deal of refinement and it is not yet
clear how
deep it is possible to go in detecting structure within the SVG image automatically.
How much
human intervention can be asked for, provided, and enabled within this framework is
an
important question too. OpenLayers provides some limited vector editing capabilities,
but how
reasonable is it to ask a user to manually split, for example, two lines that have
mistakenly
been combined into a single group?
The prospects for further development of this idea seem rich. I hope to proceed by
further
developing and refining the structure detection routines, by refining the display
capabilities
of the web interface and improving and standardizing the linking mechanisms. I plan
to seek
grant funding to work on this in the context of one or more of UNC Library’s digitized
manuscript collections later this year.