How to cite this paper
La Fontaine, Robin, and John Francis. “The Impossible Task of Comparing CALS Tables.” Presented at Balisage: The Markup Conference 2022, Washington, DC, August 1 - 5, 2022. In Proceedings of Balisage: The Markup Conference 2022. Balisage Series on Markup Technologies, vol. 27 (2022). https://doi.org/10.4242/BalisageVol27.LaFontaine01.
Balisage: The Markup Conference 2022
August 1 - 5, 2022
Balisage Paper: The Impossible Task of Comparing CALS Tables
Robin La Fontaine
Robin La Fontaine is the founder and CEO of DeltaXML. His background includes
computer aided design software, and he has been addressing the challenges and
opportunities associated with information change for many years. DeltaXML tools
are now providing critical comparison and merge support for corporate and
commercial publishing systems around the world, and are integrated into content
management, financial, and network management applications supplied by major
players. Robin studied Engineering Science at Worcester College, Oxford, and
Computer Science at the University of Hertford. He is a Chartered Engineer and
member of the Institution of Mechanical Engineers. He has three adult children,
four grandchildren, and never finds quite enough time for walking, gardening and
woodworking.
John Francis
After a brief career as an Archaeologist, John Francis has had a long career in
Computing working on many bleeding edge technologies from distributed multi-media
office systems to the first portable GUI frameworks and one of the first
UK internet shops. At DeltaXML, John is the lead R&D developer responsible for
many of our new comparison algorithms. John’s ambition is to return to digging
sometime when he can afford it.
Copyright © 2022 DeltaXML Ltd. All Rights Reserved.
Abstract
Finding out what has changed in a CALS table is remarkably complicated. Some
variant of the CALS standard is often used to represent tabular data in XML, but it
permits considerable flexibility in the form of headers, footers, and spans.
Additional complexity arises when authors use empty columns for layout or use column
or row spans specified in unusual ways, or when applications simply do not follow
the standard. In practice, comparing CALS tables directly is impossible. But maybe
that is OK if all we need is a clear representation of the changes. And if we can
represent them in a CALS table!
Table of Contents
- Introduction and Background
- What do Humans see when tables change?
- What do tables look like in XML?
- What happens if we take a standard XML comparison approach to tables?
- Building a content based approach
- How do the results of the two approaches compare?
- Different types of user, table variations and future challenges
- Conclusions
Introduction and Background
Representing information in tabular form is not new. Prior Walcher was Prior of Great
Malvern Priory way back in 1100, he was an astrologer and mathematician, and with
his
astrolabe (a clever device for measuring angles) created many tables showing the
position of the moon and other heavenly bodies. So we find tables in ancient literature
as well as modern technical manuals, data sheets, books and articles. Inevitably these
tables are revised and changed, and these changes need to be identified for review
or
even so that changes can be published, as is the case now for ISO standards which
are
now available not just as ‘Version X’ but as a red-lined document showing changes
between ‘Version X’ and ‘Version X+1’. This is much more useful for someone who is
familiar with Version X, perhaps having just spent two years implementing it.
However, it is not trivial to determine what has changed in a table, and then not
trivial to represent that change in a way that is easily understood. First, therefore,
we will look at how a human views change to tables before moving on to looking at
change
in CALS tables themselves.
The CALS table format for XML is one that is widely used and very capable, and it
has
been in use for many years. It is capable, but complex. We will briefly describe its
capabilities before moving on to the challenges of finding change between two tables
that, ideally, have the same basic structure but in reality can be very different
in
structure and content.
How should we approach XML table comparison? Since the table is represented in XML,
and we can align, compare and represent changes in XML, the obvious approach is to
compare the XML and then transform the delta into a new table showing changes. We
will
see that this approach works well when the tables have identical structure but it
soon
hits problems when the structure is different: when we add in the complexities of
column
ordering and column and row spans, we soon discover what can only be described as
an
impossible problem when approached from the comparison of the XML itself.
Impossible problems that need to be solved are not uncommon, especially in
engineering. The trick is to simplify the problem so that it can be solved and then,
as
far as possible, introduce some of the complexity back into the simplified solution.
So
this is what we do and the results turn out to be very much better than even intelligent
comparison of the original XML.
What do Humans see when tables change?
The following should be obvious but it is worth focusing on how we see tables and
what
we expect to show up as changes.
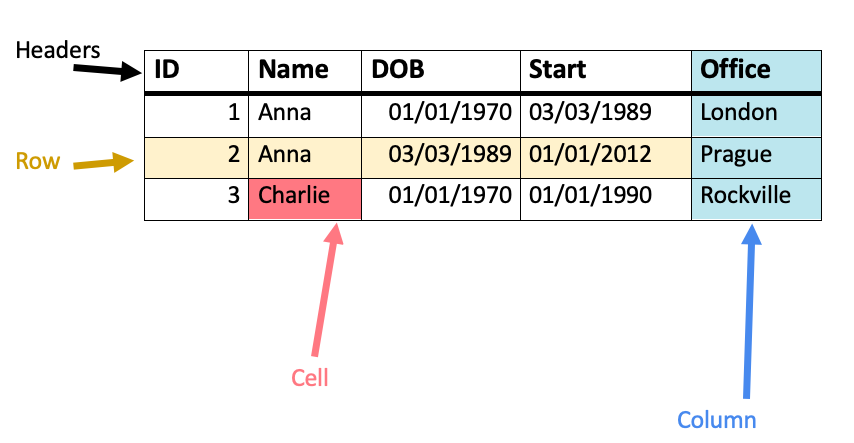
At its simplest we see tables as a grid, a rectangle divided up into rows and columns
of equal size. We are all familiar with spread sheets and the terms row, column and
cell.
In this paper we distinguish between the Content that a table contains, such as the
string ‘Anna’ in two of the cells under the header with the content ‘Name’, and the
Structure of the
table which is the markup that gives it its shape.
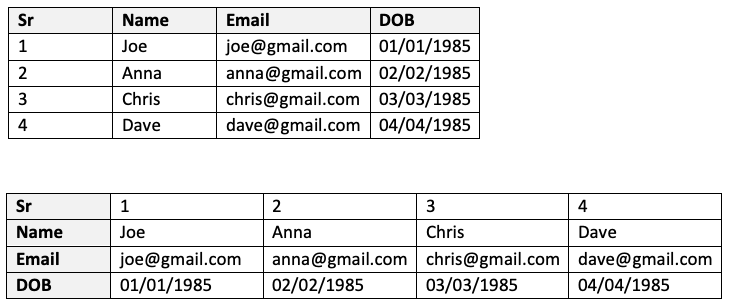
There are lots of types of tables where this grid is used in different ways. For now,
let us concentrate on the most common way that they are used. The columns here have
headers which represent common properties of the entities which are shown in rows.
So in
our example we have three employees, two Annas and a Charlie, and we record values
for
their IDs, Name, Date of Birth and Office location. When we are comparing two tables
we
expect to be comparing Names with Names, Dates of Birth with Dates Of Birth etc. When
comparing the rows we need to make sure we are matching an Anna born on 03/03/1989
and
not matching an Anna who started work on that date. In simple terms we expect to align
the columns first and then worry about the rows secondarily.
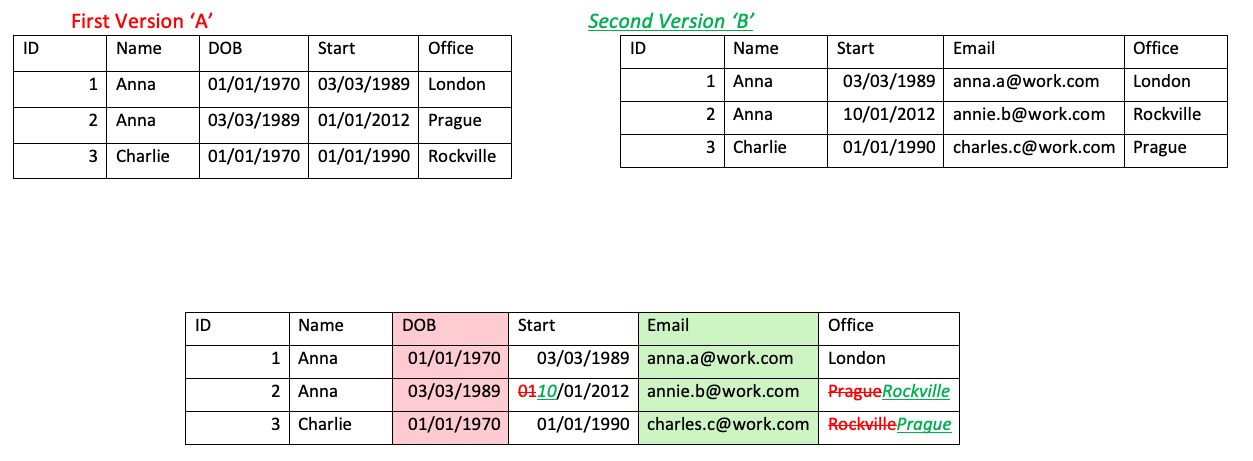
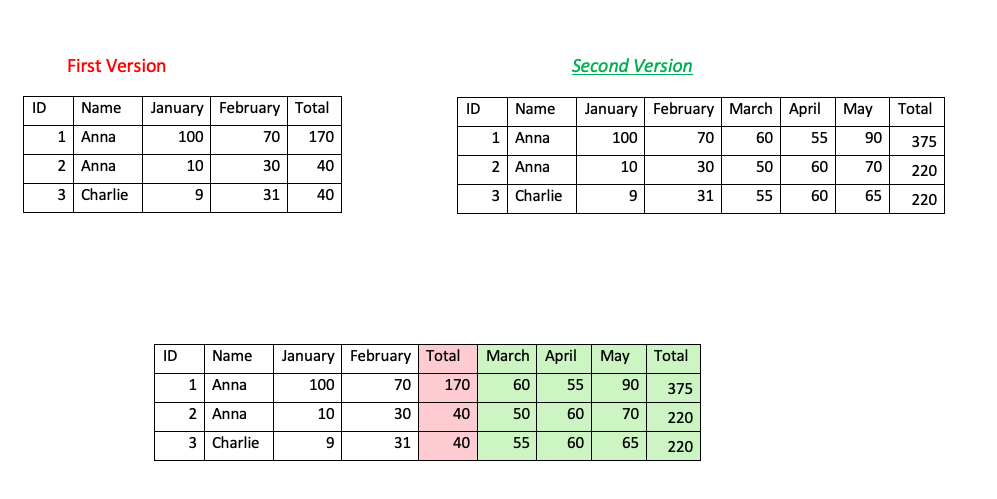
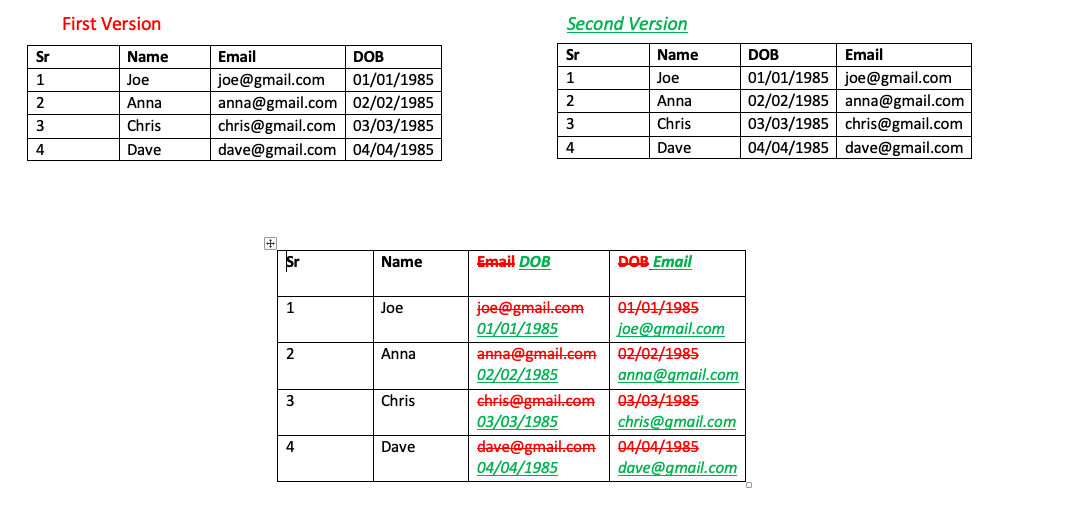
What changes between table versions? Obviously, values can change, but so can the
dimensions of the table. Columns can be added, deleted, and moved and so can
rows.
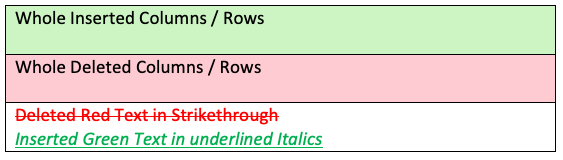
Note
We are going to be showing a lot of altered tables. We use the following conventions
to show
table changes in this paper. For Content changes to a single cell or span we show
the deleted text in red strike through font. For inserted text we show it in a green
underlined italic font. To make things clearer where edits extend to a whole row or
column we just change the background to light red for deletions and to light green
for insertions.
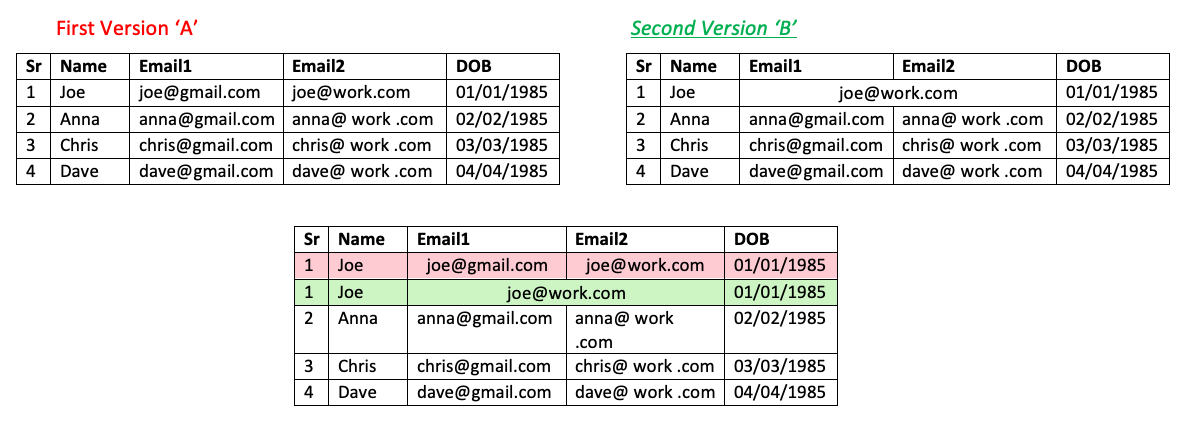
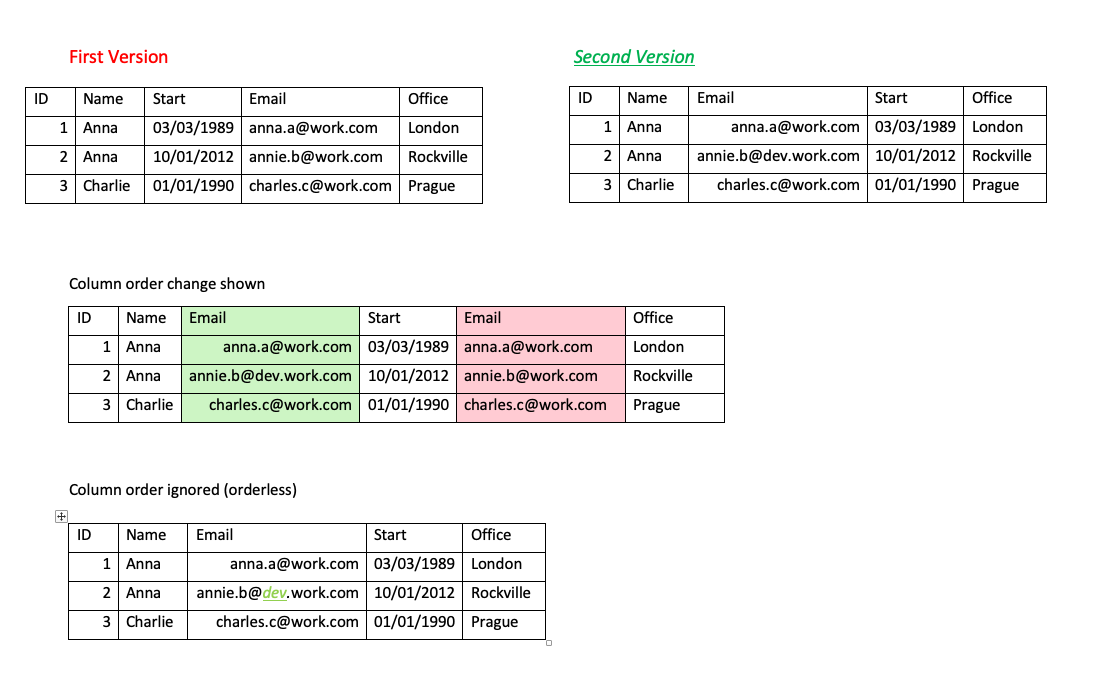
So we know columns are important, but we cannot expect to compare them simply by their
position on the grid because that changes. We might think that if columns have headers
their position is not so important and that is certainly true in some cases. In the
following example we would rather, I think, see the simple change to Anna’s email
address rather than the fact that the column has moved.
But in this example order is important.
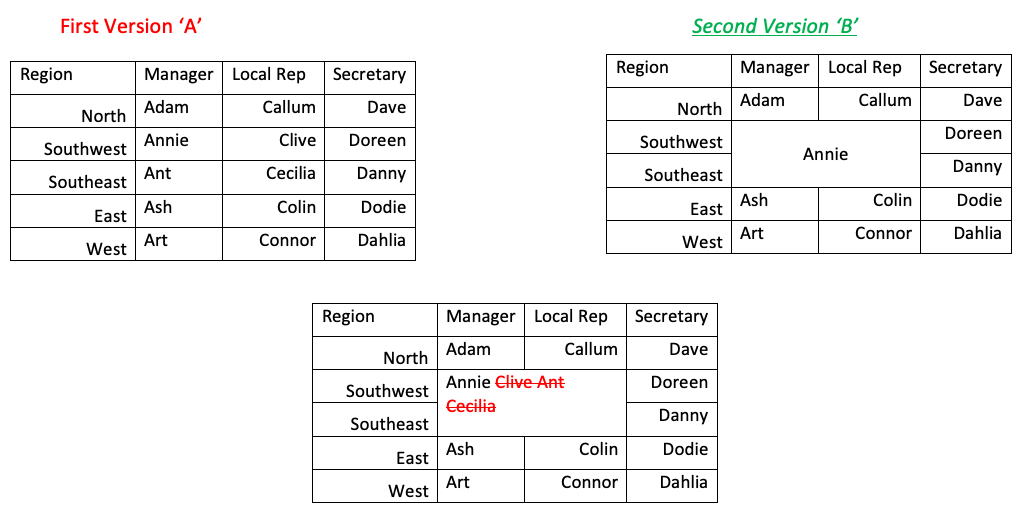
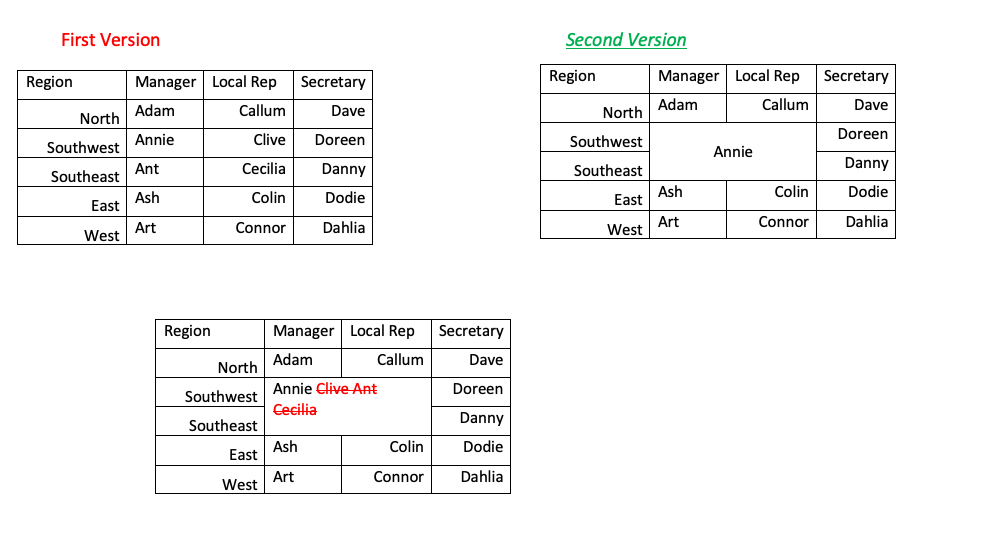
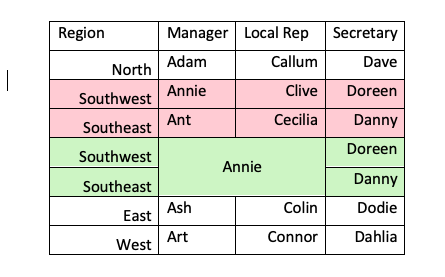
And lastly an author can make cells span across columns and rows. Spans are most often seen in multi row headers but they can also be seen in
the body of the table. And of course they can change size between versions. In the
following it would appear that Annie is now managing all the Southern Region and acting
as its Local Rep, taking over from Clive, Ant and Cecilia. We have chosen to show
the
content changes rather than preserving any information about any original span. It
works
well in this story, but may not in others.
There are different types of users. Most users are interested in seeing the change
to
the values of the cells. But another group of users are technical and wish to see
what
parts of the markup have changed, for example when they are having problems rendering
it
after edits. Over time we encounter fewer of the later technical group and more of
the
former.
What do tables look like in XML?
There are a few variants of the CALS specification. The Exchange Table Model
[1] is the most widely supported version. The behaviour
of editors and renderers varies once you move away from the more basic structures,
but
in this synopsis we are only showing things which we have encountered or which can
render.
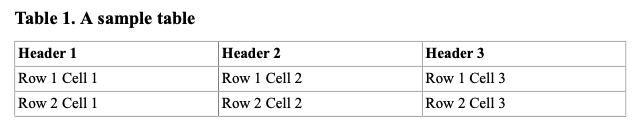
It is probably easiest to give an overview of the CALS spec using a simple
example:
<table frame="all">
    <title>A sample table</title>
    <tgroup cols="3">
        <thead>
            <row>
                <entry>Header 1</entry>
                <entry>Header 2</entry>
                <entry>Header 3</entry>
            </row>
        </thead>
        <tbody>
            <row>
                <entry>Row 1 Cell 1</entry>
                <entry>Row 1 Cell 2</entry>
                <entry>Row 1 Cell 3</entry>
            </row>
            <row>
                <entry>Row 2 Cell 1</entry>
                <entry>Row 2 Cell 2</entry>
                <entry>Row 2 Cell 3</entry>
            </row>
        </tbody>
    </tgroup>
</table>
In CALS the table element is an outer wrapper for grouping what we
actually regard as tables. It is the tgroup element which represents the
grid of columns and rows which we view as a table. The tgroup defines,
using its cols attribute, the number of columns that all its constituent
rows have. A tgroup then has two groups of rows: rows in an optional
thead define the headers, and rows in the tbody describe
the main body of the table. Inside thead and tbody we then have the
rows, and inside them entry elements define the cells. As
we would expect, the above XML renders like this.
Things start to get more interesting when we add some spans across columns and
rows. For horizontal or column spans CALS requires us to define colspec
elements inside the tgroup to give the columns names. We can also use
colnames on entrys to specify the absolute column an
entry belongs to. For vertical spans we just use a
morerows attribute on a starting cell.
<table frame="all">
    <title>A sample table</title>
    <tgroup cols="3">
        <colspec colname="c1"/>
        <colspec colname="c2"/>
        <colspec colname="c3"/>
        <thead>
            <row>
                <entry>Header 1</entry>
                <entry>Header 2</entry>
                <entry>Header 3</entry>
            </row>
        </thead>
        <tbody>
            <row>
                <entry namest="c1" nameend="c2" morerows="1">A Span across 2 Columns and 2 Rows</entry>
                <entry colname="c3">Row 1 Cell 3</entry>
            </row>
            <row>
                <entry>Row 2 Cell 3</entry>
            </row>
        </tbody>
    </tgroup>
</table>
which renders:
So we have to take into account ‘over hangs’ from the preceding rows when working
out the position of an entry: notice that there is only one cell specified
in the second row of the tbody. Unlike HTML tables, CALS tables define the
position and horizontal extent of each entry using text labels which are
cross references to groups of colspec elements. This means we have to
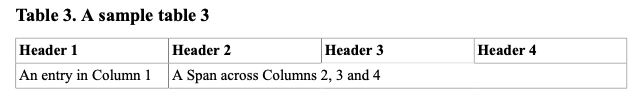
analyse the colspec elements to work out the column positions. CALS allows
us to define colspecs only when necessary and use colnum
attributes to specify the postion of a colspec.
<table frame="all">
    <title>A sample table 3</title>
    <tgroup cols="4">
        <colspec colname="c2" colnum="2"/>
        <colspec/>
        <colspec colname="c4"/>
        <thead>
            <row>
                <entry>Header 1</entry>
                <entry>Header 2</entry>
                <entry>Header 3</entry>
                <entry>Header 4</entry>
            </row>
        </thead>
        <tbody>
            <row>
                <entry>An entry in Column 1</entry>
                <entry namest="c2" nameend="c4">A Span across Columns 2, 3 and 4</entry>
            </row>
        </tbody>
    </tgroup>
</table>
which renders as:
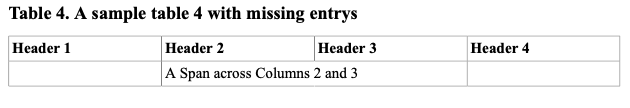
Lastly this mechanism means we do not have to specify any entry which
is empty.
<table frame="all">
    <title>A sample table 4 with missing entrys</title>
    <tgroup cols="4">
        <colspec colname="c2" colnum="2"/>
        <colspec/>
        <colspec colname="c4"/>
        <thead>
            <row>
                <entry>Header 1</entry>
                <entry>Header 2</entry>
                <entry>Header 3</entry>
                <entry>Header 4</entry>
            </row>
        </thead>
        <tbody>
            <row>
                <entry namest="c2" nameend="c3">A Span across Columns 2 and 3</entry>
            </row>
        </tbody>
    </tgroup>
</table>
which still renders correctly as:
What happens if we take a standard XML comparison approach to tables?
As we saw in ‘What do Humans see when tables
change?’ above, a key part of comparing tables is to align the columns. It is
also obvious that CALS XML is a serialisation format and cells cannot be contained
as
child elements in both column and row wrappers. We also know that cells do not always
appear one after the other as in a grid but straddle rows and in some cases where
there
is no data for a cell there may be no XML element to represent it. So we have to
identify the cells as belonging to a column based on the attributes which reference
them, colname, namest.
We can then use keying to consistently align cells for each row. In this, our original approach to
table comparison, we also had in mind two other principles. Firstly, we try to create
an
output which does not loose information about either input, and which can be used
at any
level of the hierarchy to ‘accept or reject’ changes. Secondly, a related principle
is
to show changes which a technical user might be interested in, particularly
colspecs, and try to preserve their use as markup in the result. For
the 80% of cases where the structure of the tables being compared was similar and
colnames were used consistently, this approach works efficiently and
well. However, in more complex cases this mind set proved limiting, and led to some
changes being displayed at a much coarser level than they occurred and in other cases
the changes were shown interleaved.
For example, where there are spans on one version of a row and not another, there
is
no way to show the change in native CALS markup, so we opted instead to show two
separate rows, one added and one deleted in order not to lose information.
This is clear enough when the scope is the occasional row, but this approach to
dealing with ‘structure conflicts’ rapidly escalates to show the whole
tgroup as changed.
A further problem was in the reliance on colspec
colnames themselves. There is nothing to say that an application should not
regenerate these differently on every save, or that different authors must choose
the
same naming scheme. Two CALS table versions whose only difference is in the set of
colnames they use are still the same table as far as the reader is
concerned. This meant we also chose to use other comparison methods based on the
position of cells or aligning based on the content of cells on a row-by-row basis.
Heuristics at the end of the comparison chose between the tables based on validity
[3]. In turn this led to the rejection of
some comparisons based on minor technicalities. For example, opting not to use
alignments where the original colnames were duplicated when we could simply
have renamed them. So a simple column move is not shown where it could be.
Building a content based approach
So treating table alignment as a variation on general XML alignment has its
drawbacks. Originally our users were very technically aware and interested in the
detail
of the markup. Nowadays they are more interested in seeing the final result in a
rendered table. In our Data products we have been working on algorithms to compare
the
content of structures using probabilities, and we use these techniques to decide which
columns align best.
Before we can do this we need to regularise the tables which involves some fairly complex
processing with the objective of representing the table in a regular rectangular grid
on
which the comparison can be performed. The result of this comparison is a standard
XML
file in our deltaV2 format [4] with every cell in its column along with metadata about
how columns have been aligned.
deltaxml:table-column-alignment="A|1=B|1, A|2=B|2, B|3, A|3=B|4, A|4"Whilst all the information has been preserved and only metadata in the deltaxml
namespaces added, the result is complex and not a valid CALS table for rendering.
Our
users have been clear that having a valid table that renders is a major requirement
for
them since the documents are intended for reading. So in our output pipeline we now
have
to unwind the regularisation
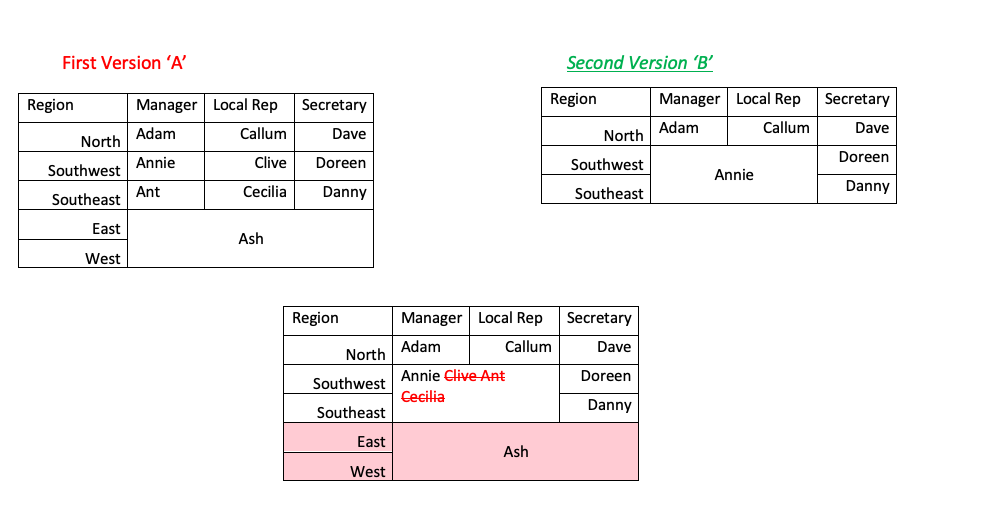
process and restore spans. Here we have departed from our previous principle that
we
should not lose information but instead we reworked information like
colspecs to produce a valid table. We cannot show changed spans so we
compromised by deciding to preserve the spans of the second or ‘B’ version, and show
the
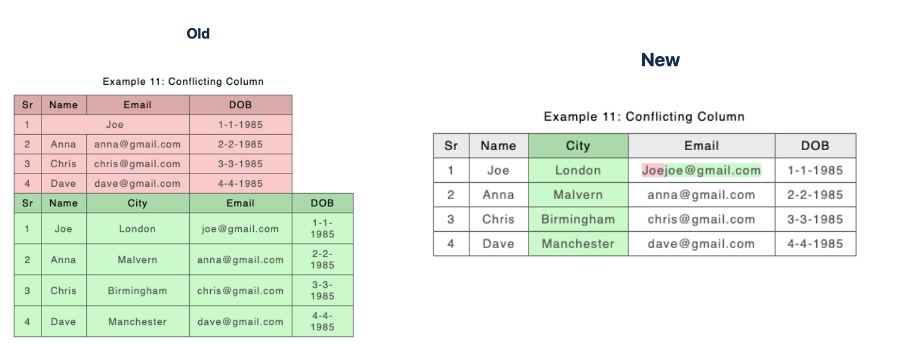
changes of the content within that. We saw this approach in the first section where
there is a span for the 2nd and
3rd columns for the 3rd and
4th rows in the second version but not the first.
Our previous approach would have shown this as:
In the case where a column or row consist of content only from the first or ‘A’
version which is not overlapped by any span from the second version we keep the
spans for that version as well.
How do the results of the two approaches compare?
Our User Guide [5] has a more systematic run down of the cases based on our
public bitbucket CALS samples [6]. Here we will show a
few examples only.
The examples in this section are rendered in a slightly different way from the
previous examples as they have been produced from DocBook sources compared using our
product which styled them into HTML with a bespoke filter. They differ in that the
values of cells that have changed are shown using fonts with a different background
colour, and not using strike through, italics and underlining. Light red for deletions
and light green for insertions.
For cases where the structure of the tables remains the same and the change is
relatively limited the results from the old and new approaches are the same.
In the case where a column moved, we now give a clearer result:
Where we have overlapping changes like when an inserted column intersects a
pre-existing span, the changes are now finer grained.
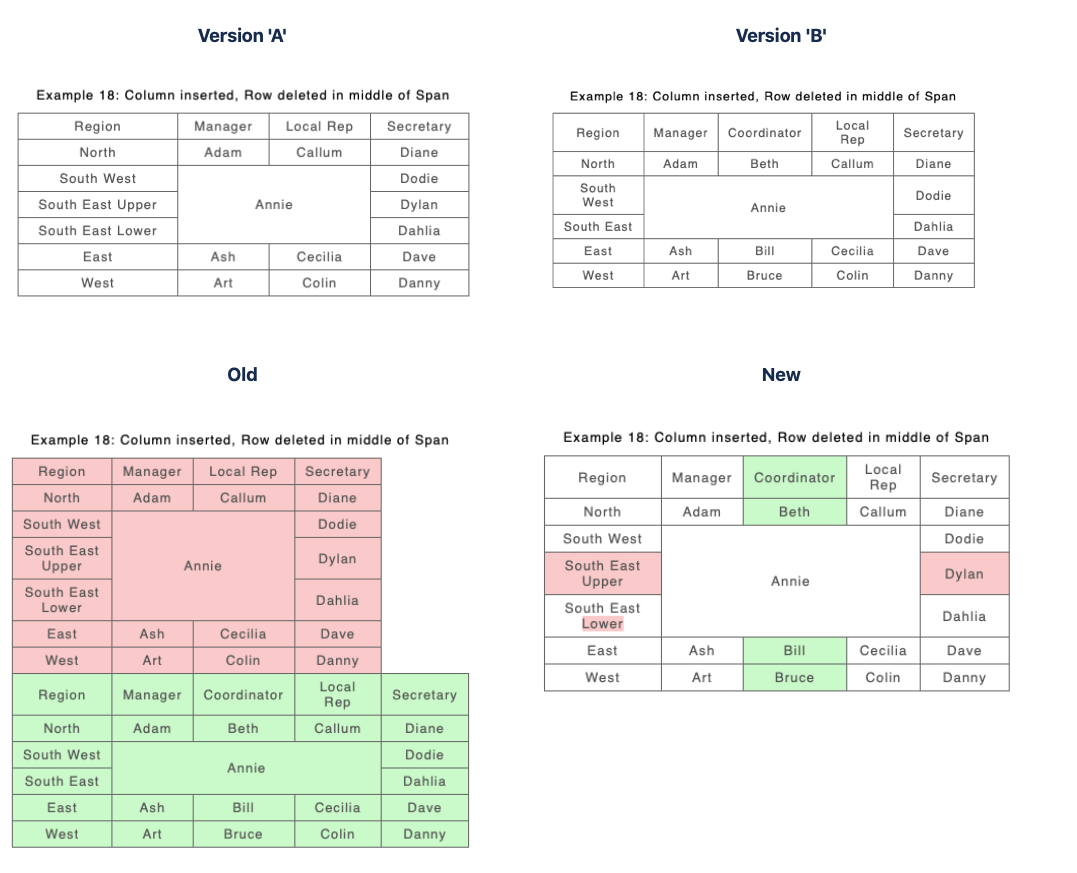
Finally where we have complex cases where multiple changes intersect an otherwise
unchanged span we still get fine grained results. In the following the row which begins
with South East Upper has been deleted, the column headed Coordinator has been inserted
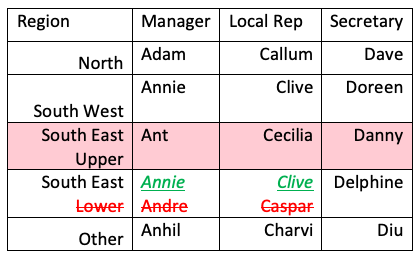
and the value ‘South East Lower’ has been renamed just ‘South East’.
Different types of user, table variations and future challenges
In moving to this new approach, we were guided by our users who gave us the
following principles:
-
To see changes to the values of cells wherever possible.
-
The result should contain valid table markup which can be rendered.
-
Not to have to spend lots of effort saying what type of table they are
using, at least to begin with.
-
To have the difference be more robust than focusing just on the structure
of the underlying markup.
-
They should be able to see clearly that a cell belongs to a certain row
and column in the grid. Even when rows are ragged with missing cells, the cells
should be positioned under the column header to which they belong.
We have concentrated in the latest approach on providing the best result out of
the box following these user requirements. But as we said, not all tables and users
are the same.
For those users who are interested in the fine detail of the markup changes they
can still switch off table comparison, and compare the raw XML. But what about other
table variations?
We have allowed users to specify whether the columns in an individual table should
be treated as ordered or orderless. This provides users with control so they can treat
the two examples we saw in the second section
differently depending on their requirements.
Another variation of table is where the user chooses to use columns to format
tables in a consistent way, hiding columns by putting spans across sets of columns
so they appear as one.
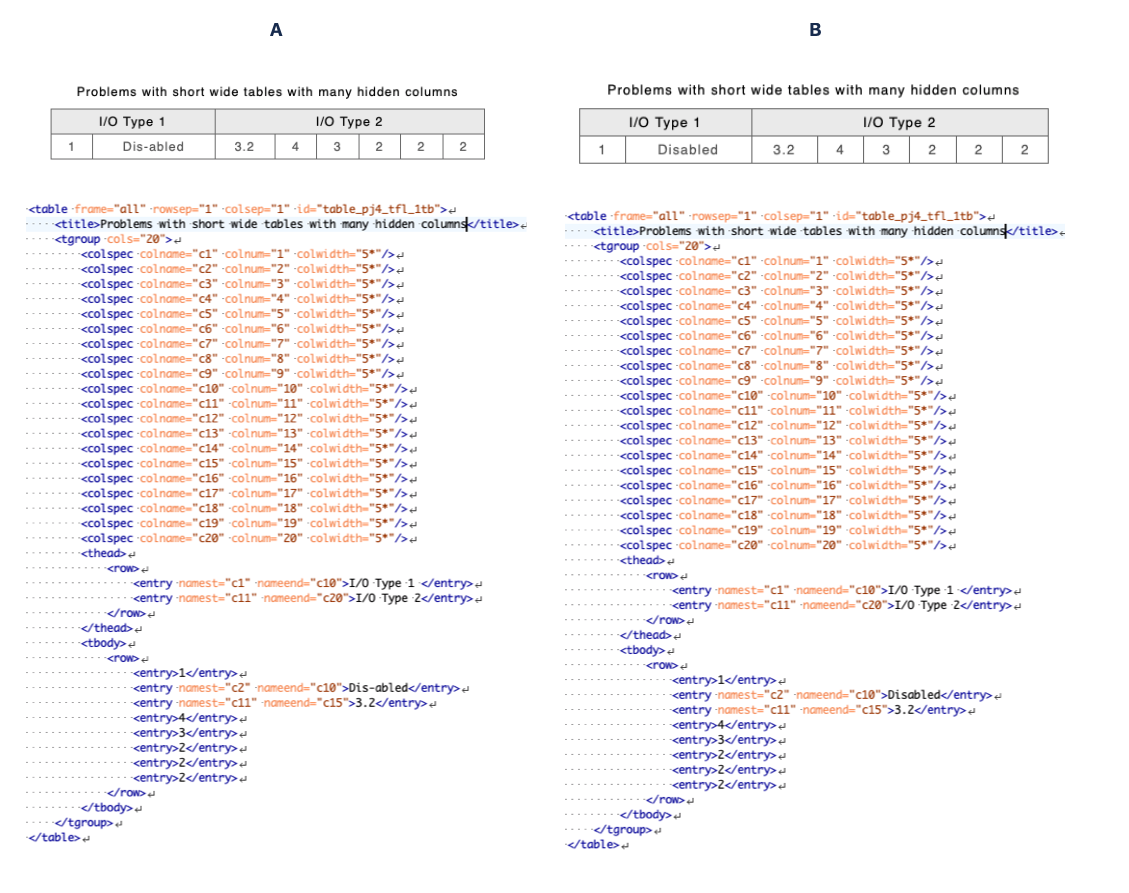
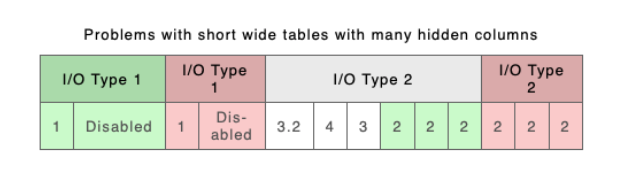
A related ‘problem table type’ are those tables where most columns contain the
same data. Currently the algorithm which compares columns is tuned to look for
similarities which have a certain degree of significance (in the statistical analysis
sense), and sometimes repeated data can cause problems. For now we allow users to
specify via processing instructions that these types of columns should be compared
using
their position or colname. This allows users to take complete control over
which columns should align. Without using this, the table comparison above gives a
result
like this:
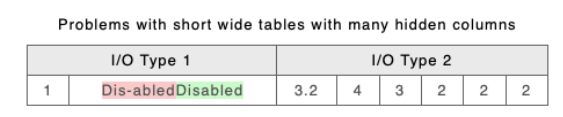
With this additional control over the table comparison, we get a better
result:
One type of table which we have not currently explicitly taken account of is the
case where the role of columns and rows are switched as if the table had been rotated
by
90° anti clockwise:
In some cases we made arbitrary choices on how we show the changes in line with
our users’ requirement that it should just work without configuration. The core
comparison of the tables is separate from the way that changes are displayed and we
anticipate users might want to display changes in different ways. Providing this
control would, of course, add complexity.
For example, where rows have been deleted and the latest version has spans which
cross them, we show the span crossing the deleted row. Users might find it clearer
to
have the span break to show the whole row deleted, and this would certainly help
making accept changes easier:
whereas we could show it as:
Conclusions
Coping with the wide range of ways a user can make changes to a table is challenging
if we want to show the minimal amount of change. Restricting ourselves to comparing
tables as XML markup may be useful to the technical user but is less satisfactory
when
looking at the rendered result, and it is this rendered result that is of interest
now
to the majority of users, who tend to be less technical. This paper describes an
improved approach that centres on analysing the content of tables in a regularised
form
and making choices based on how a final reader of the document would perceive it.
This
gives a finer-grained rendering of changes and is likely to be more useful to a wider
range of users.